gistribeのTwitterイラスト検索結果。 18 件


How wind anomalies and a phenomenon called 'global stilling' are affecting wind farm electricity generation.
https://t.co/zH2iYh1Zem
#gistribe #FTfreetoday
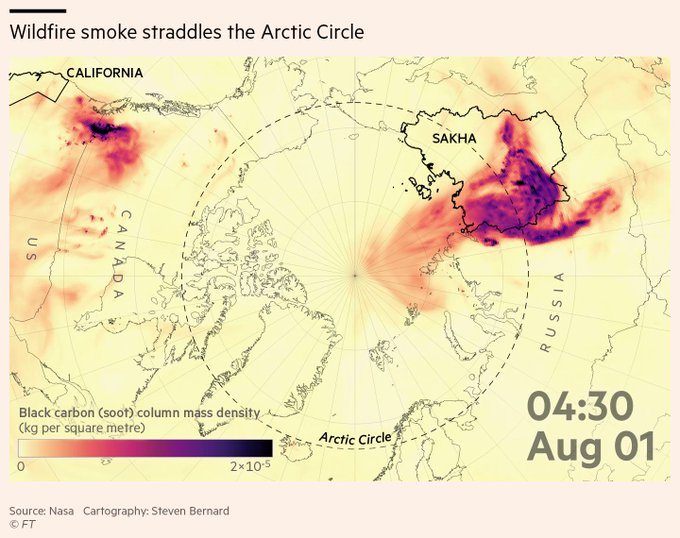
This week's climate graphic is on Siberian wildfires and how the smoke from these blazes straddled the Arctic Circle in August and led to the highest carbon emissions on record
Read @lesliehook's fascinating report
https://t.co/aAw3cZbf17
#gistribe #dataviz

This week's climate graphic looks at the record temperatures reported across the northern hemisphere on June. Data supplied by @CopernicusECMWF
Read @lesliehook's report
https://t.co/7jG1WYVfQb
#gistribe #dataviz #HeatWave2021 #ClimateCrisis


Had a blast working with @lesliehook and @hjesanderson on this incredible long read on the transition from fossil fuels to clean energy gathering speed, and what it means for the balance of power
Thanks to @VaisalaGroup for the map data
https://t.co/RUuRFGYla0
#gistribe #dataviz
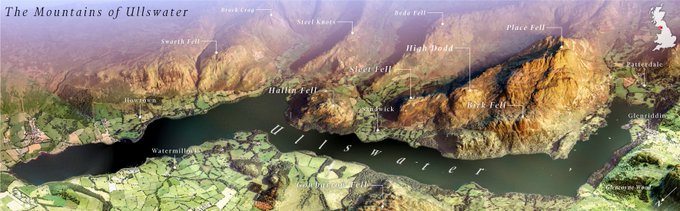
What better way* to spend a sweltering Saturday afternoon than creating a 3d-model of #Ullswater in #Blender3d, using @DefraData's #lidar download interface.
https://t.co/HNmypUNAiQ
#gistribe #mapporn
* There probably are better ways but this does it for me!
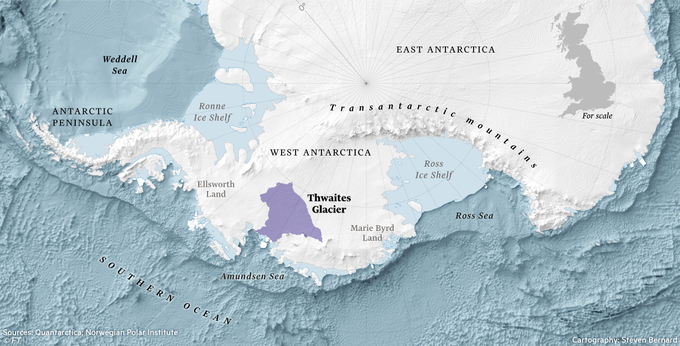
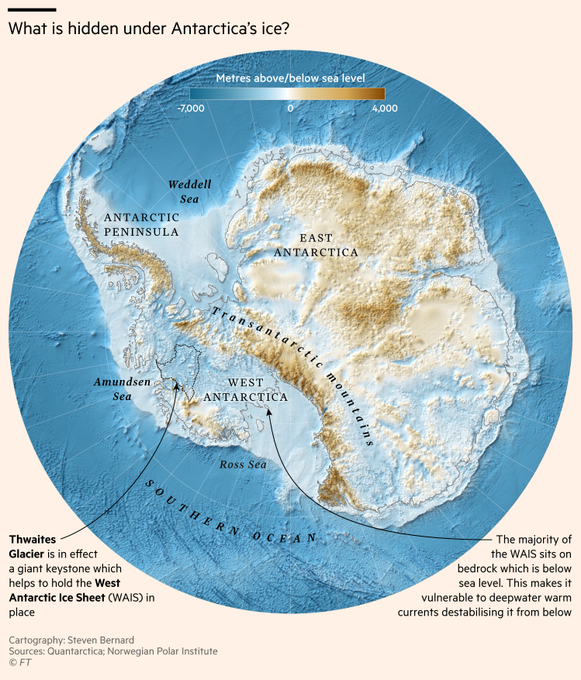
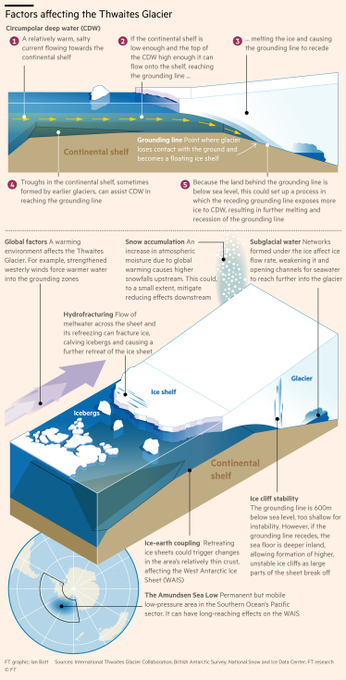
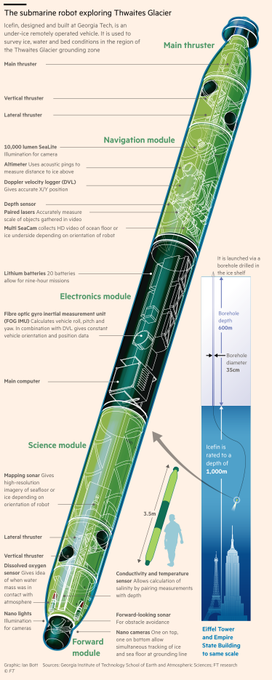
ICYMI: @lesliehook's fascinating if unsettling piece on the melting Thwaites Glacier in Antarctica, and what it means for global sea-level rise.
Beautiful @ian_bott_artist illustrations and #cartography by me
https://t.co/kC9l630xy4
#gistribe #ClimateChange #mapporn #dataviz


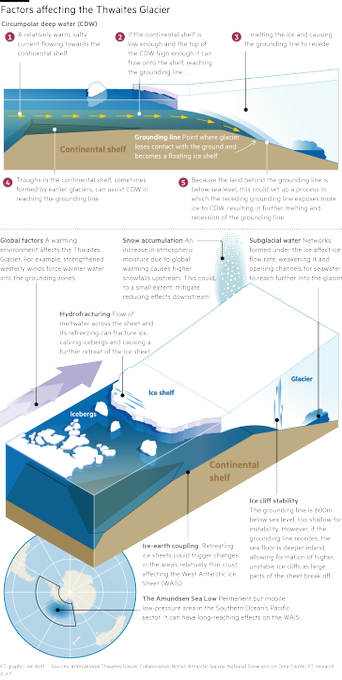

GRAPHICS-FEST in this fascinating article by the brilliant @lesliehook about the Thwaites 'doomsday' glacier in Antarctica. This was a real labour of love, beautiful illustrations by @ian_bott_artist and maps by myself
https://t.co/kC9l630xy4
#gistribe #dataviz #ClimateChange

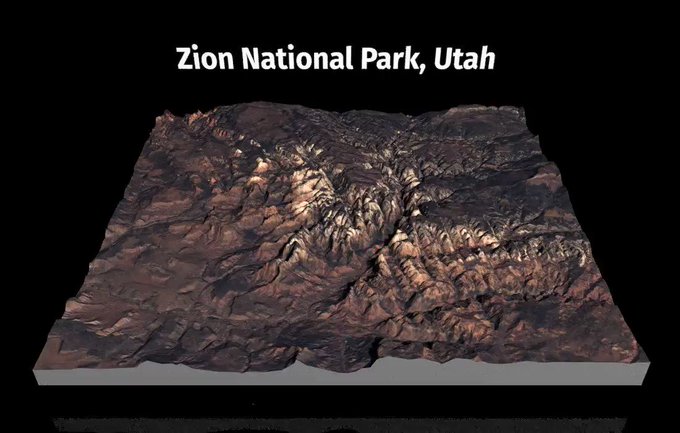
‼️NEW BLOG POST! You asked for it, and you got it!
"A Step-by-Step Guide to Making 3D Maps with Satellite Imagery in #rstats"🗺️🛰️
https://t.co/os92oLm4I7
I walk through getting the data, loading the imagery, and creating the 3D viz w/ #rayshader. All code included. #gistribe


It's that time of year so I thought I'd share my 4 favourite maps I worked on this year at the @FinancialTimes
https://t.co/SNfKLTNNeH
https://t.co/3C5URvH9TU
https://t.co/sGdAnANgV7 – Manhattan property
https://t.co/mIPEdd48nf – London pollution
#gistribe #dataviz #ddj

Can't wait to pick up a copy of today's @FinancialTimes to see this on the front page of House & Home!
#dataviz #ddj #gistribe

3D MAP showing the explosion of luxury apartments that are reshaping Manhattan’s skyline, leading to a glut of prime property. Great article by @hugobriefly and @FinancialTimes’ @GeorgeNHammond
https://t.co/0yS8oY0vQm
#gistribe #dataviz #ddj


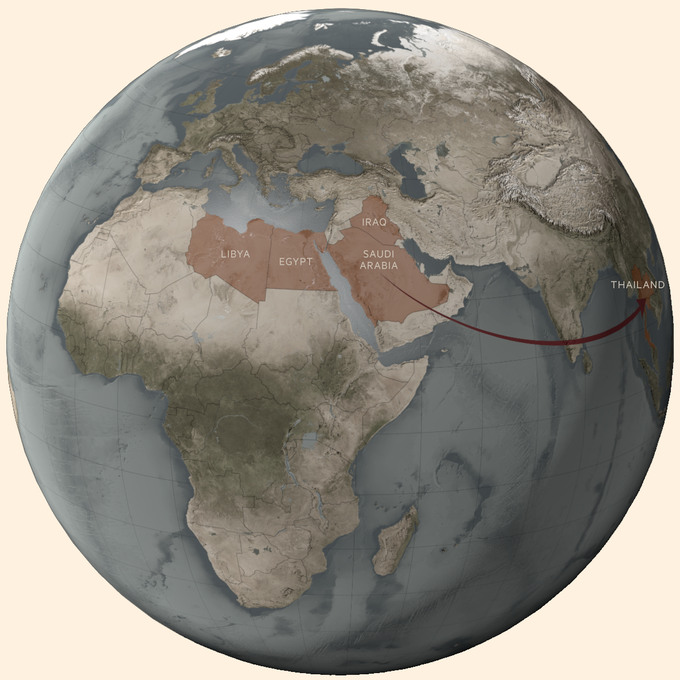
MAPS: Custom azimuthal equidistant projections to compare world's longest flights. Great teamwork with @FinancialTimes @martinstabe, awesome artwork as ever from @ian_bott_artist #gistribe #dataviz
https://t.co/8nUPwQGCsi

Young home buyers in London are between a rock and a hard place https://t.co/HSIcjECjzr @FT #gistribe #London #propertycrisis
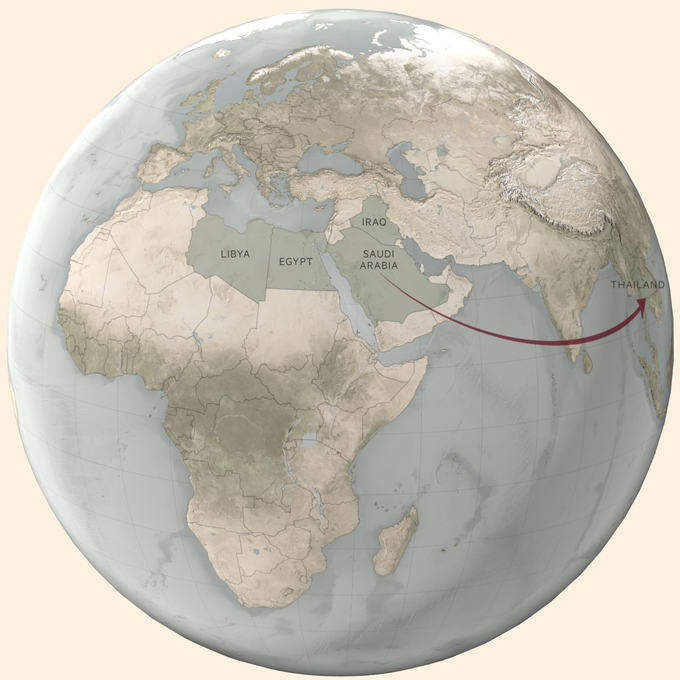
3D globes in Blender/QGIS/Pshop. Quick how to guide on Medium https://t.co/4Nj7vINa5g #GIS #gistribe #QGIS

I think I prefer the lighter version. What do people think? #GIS #gistribe #QGIS #blender3d