VisualizationのTwitterイラスト検索結果。 876 件中 44ページ目


Python Visualization Libraries List
http://t.co/2vJeF0b0hL


New Post: Visualization of a Function Through Time http://t.co/Dx39TT8vaQ #mathart #whatgoodisthisfor?


Revisiting one of our favorite visualizations this year. Simple. Clean. Meaningful. http://t.co/Kr28cyXO79


SCIENCE VISualizations for the 2016 #VIZZIES – due next week! Submit by 9/15 http://t.co/yxTYUrB43K #SciArt #BioArt


STUART BRIERS ILLUSTRATION: VISUALIZATION
http://t.co/f5GdaJsJwK
#illustration @RappArt


How to create an awesome data visualization http://t.co/FRd4ynhG5h via @danielzeevi on @DashBurst #Dashburst #Design


A Proportional Visualization of the World’s Most Popular Languages http://t.co/kfQNjWPm6b


CALL for SCIENCE VISualizations, #SciArt, #BioArt for the 2016 #VIZZIES!! http://t.co/yxTYUrjsFa by 9/15 @NSF @PopSci


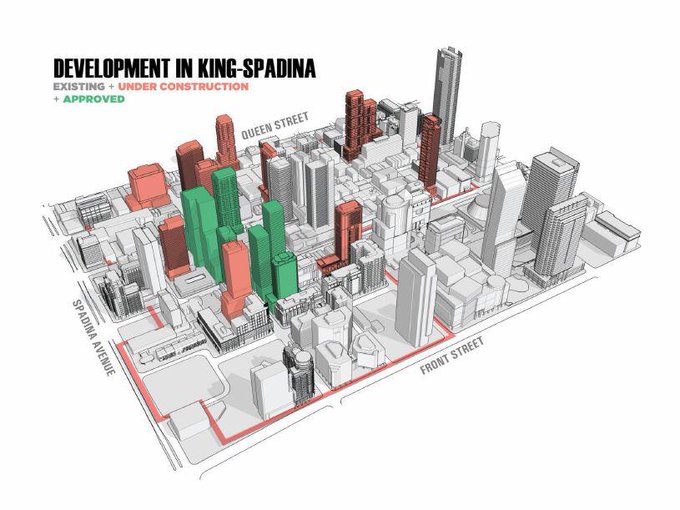

Fascinating @CityPlanTO visualization. Dev in King-Spadina:
- existing
- under construction
- approved
- proposed


The "Atlas of Infographics" compiles 280 contemporary data visualizations: http://t.co/x4XDCX9i3L


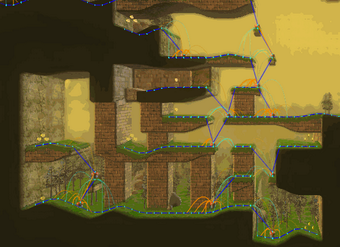
3D Visualization assignments from the Term 3 FZD students - https://t.co/KXfUh0P56l


"I See a Future" by @OnnyRananta, an artist from Solo. As he said of his works, "A heart-telling visualization".