Numpy,のTwitterイラスト検索結果。 10 件


Day 26 of the #30DayMapChallenge - Islands. 3D digital elevation model of Taiwan
This map was made with #Python using #Numpy, #matplotlib and #earthpy. #data #DataScience #data #dataviz #DataScientist #geography #artwork #art

Day 2 of the #30DayMapChallenge - Lines.
Contour line map showing the topography of Great Britain.
This map was made with #Python using #Numpy, #matplotlib and #earthpy. #data #DataScience #data #dataviz #DataScientist #uk #gb #eu #geography

Topography map of the United Republic of Tanzania.
The colormap goes black-green-blue-yellow from low to high altitudes.
This map was made with #Python using #Numpy, #matplotlib and #Pandas. #Data #DataScience #dataviz #geography #artwork #art #Tanzania

Topography map of France. Colours correspond to the of the national flag. #TopographyTuesday
This map was made with #Python using #Numpy, #matplotlib and #Pandas. #data #DataScience #data #dataviz #DataScientist #eu #geography #artwork #art #France #Map

Topography map of Kenya. Colours correspond to the of the national flag. #TopographyThursday
This map was made with #Python using #Numpy, #matplotlib and #Pandas. #data #DataScience #data #dataviz #DataScientist #eu #geography #artwork #art #Kenya #Africa #Map

What does the world really look like? As we all know the earth is flat so here is the map of the world that we should be teaching in schools. Day 28 of the #30DayMapChallenge - #Python #Numpy, #matplotlib #. #data #DataScience #data #DataScientist #icewall #FlatEarth #sheep

3D digital elevation model of Taiwan for day 19 of the #30DayMapChallenge - Islands.
This map was made with #Python using #Numpy, #matplotlib and #earthpy. #data #DataScience #data #dataviz #DataScientist #geography #artwork #art
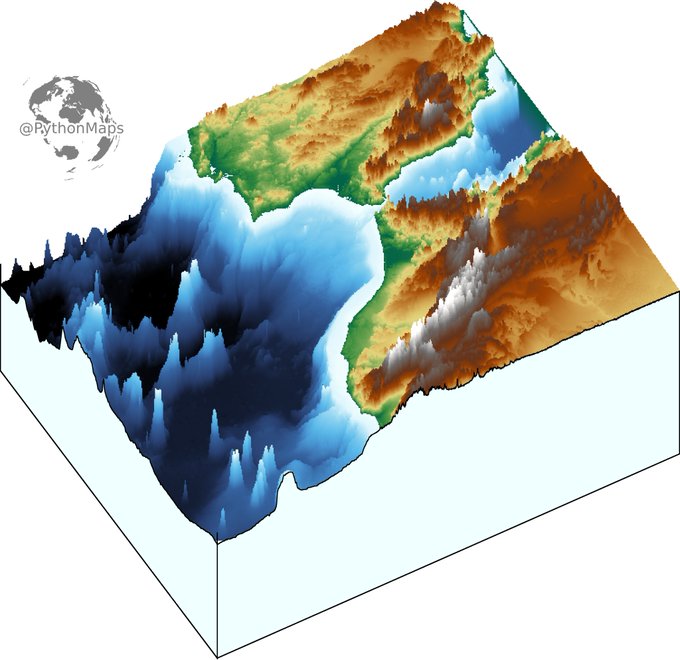
3D digital elevation model of the strait of Gibraltar for day 11 of the #30DayMapChallenge .
This map was made with #Python using #Numpy, #matplotlib and #earthpy. #data #DataScience #data #dataviz #DataScientist #eu #geography #artwork #art #Gibraltar #Brexit

Topography map of the greatest country in the world... Ireland. Colours correspond to the national flag obviously.
This map was made with #Python using #Numpy, #matplotlib and #Pandas. #data #DataScience #data #dataviz #DataScientist #Ireland #eu #geography #artwork #art

Contour line map showing the topography of Great Britain. Zoom in!
This map was made with #Python using #Numpy, #matplotlib and #earthpy. #data #DataScience #data #dataviz #DataScientist #uk #gb #eu #geography #artwork #art