rayshaderのTwitterイラスト検索結果。 17 件


A forest map of Perú using data from 2019.
#rayshader adventures, an #rstats tale
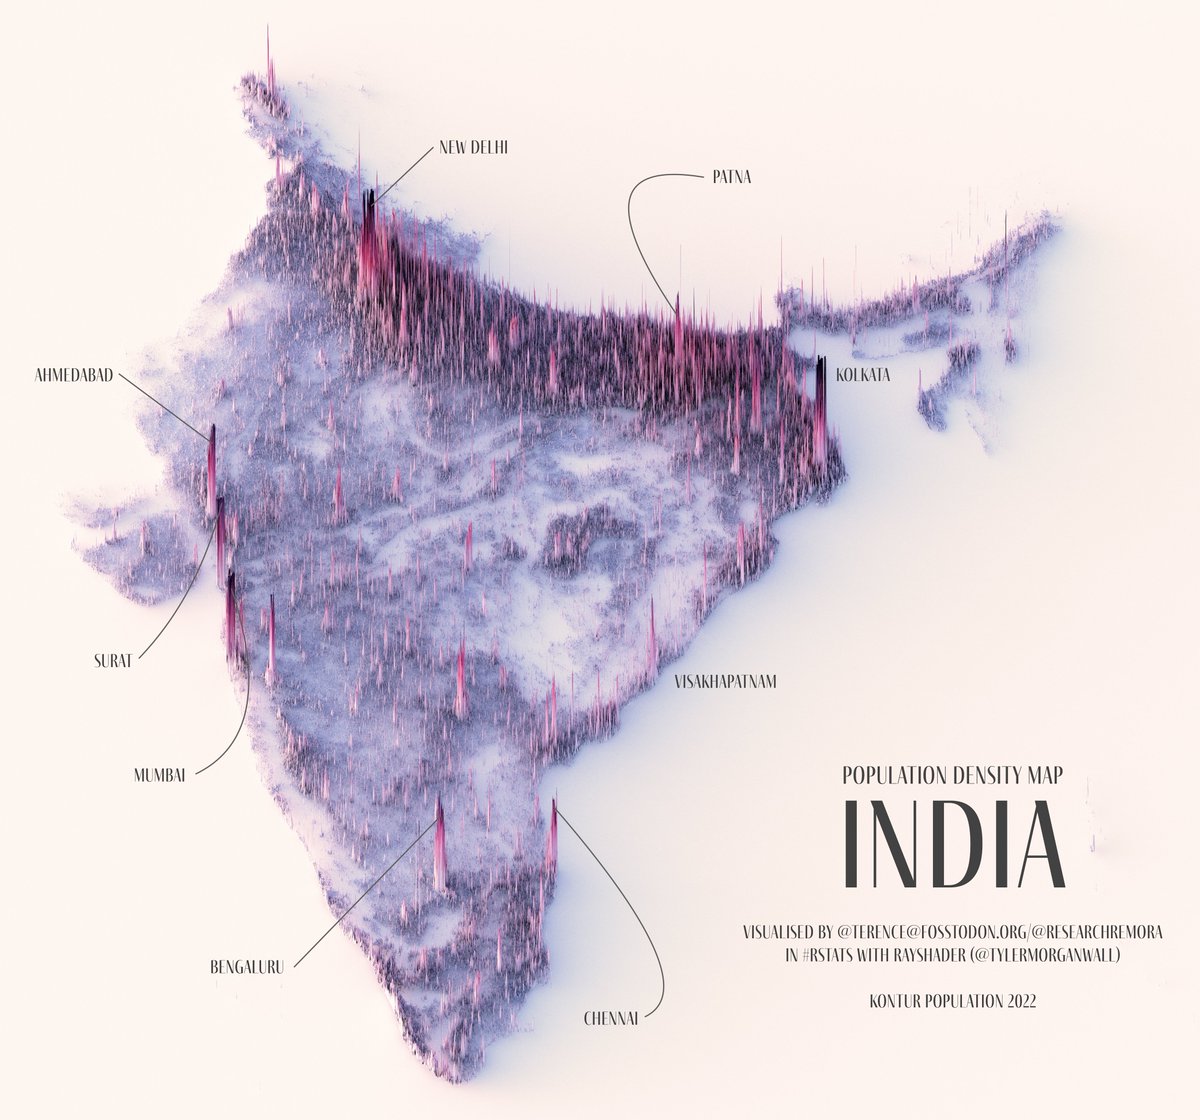
Also had lots of requests for this one: a population density map of India. This was by far the longest render.
Well, except for furry France, which still holds the record.
#rayshader adventures, an #rstats tale

A population density map of the Tōhoku region, which comprises six prefectures: Akita, Aomori, Fukushima, Iwate, Miyagi, and Yamagata. Hope I got all the labels right. 😅
#rayshader adventures, an #rstats tale


Boho Silk Fabric Iray shaders released to
@daz3d. Can be combined with animal prints or leather.
https://t.co/vGogi7HrKd
#3dmodeling #daz3d #nelmi #texturing #irayshaders #3dmodels #dazstudio #fabrics #fabric #fashion #bohostyle #clothing #3dclothing #CGI #cg #silk #nelmi3d

In response to a DM, here's a shaded relief map of México! This gives me the opportunity to showcase @paezha's cool package {MexBrewer}, which contains colour palettes inspired by the beautiful works of Mexican muralists.
#rayshader adventures, an #rstats tale

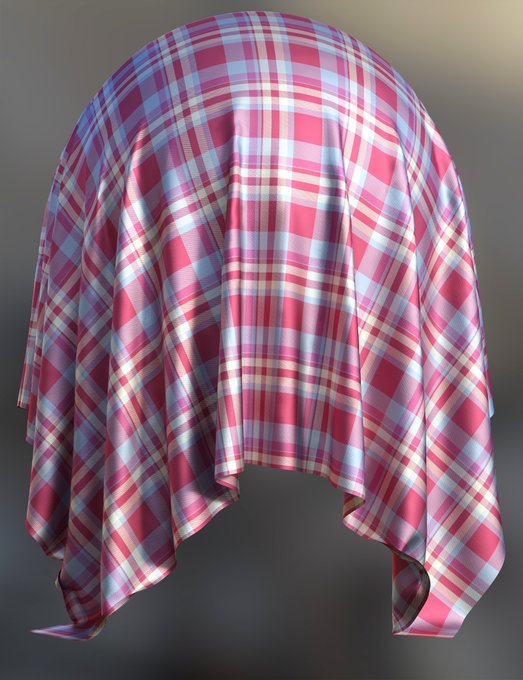


Summer tartan silk fabric Iray shaders released to my store @daz3d today! 60 shaders!
https://t.co/QNxS45Xyws
#3dmodeling #daz3d #nelmi #texturing #irayshaders #3dmodels #dazstudio #fabrics #fabric #fashion #tartan #clothing #3dclothing #CGI #cg #shiny #nelmi3d #Elegant

At 592m, here's a shaded relief map of the deepest lake in the United States—Crater Lake. How deep is that? Stack the Eiffel Tower, Washington Monument, and the Statue of Liberty atop one another and we still won't reach the lake's surface.
#rayshader adventures, an #rstats tale

A shaded relief map of Lake Tahoe, California.
#rayshader adventures, an #rstats tale


This was cooking in the oven—a more fitting render of the Red River.
#rayshader adventures, an #rstats tale


Elevation data from part of the Chugach Mountains, Alaska. Data from https://t.co/Hk5VXyo5Su #rayshader #QGIS #RStats

Lavender shag. Inspired and made possible by @geokaramanis.
#rayshader adventures in #rtistry, an #rstats tale

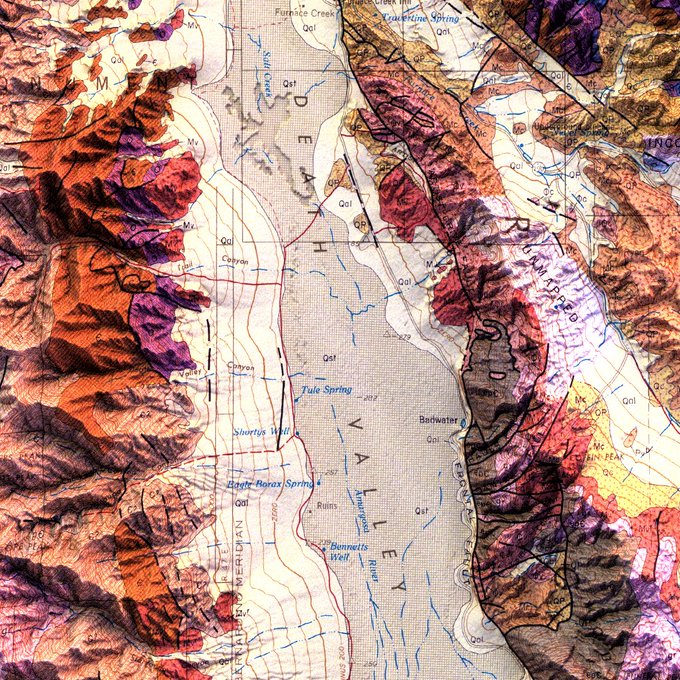
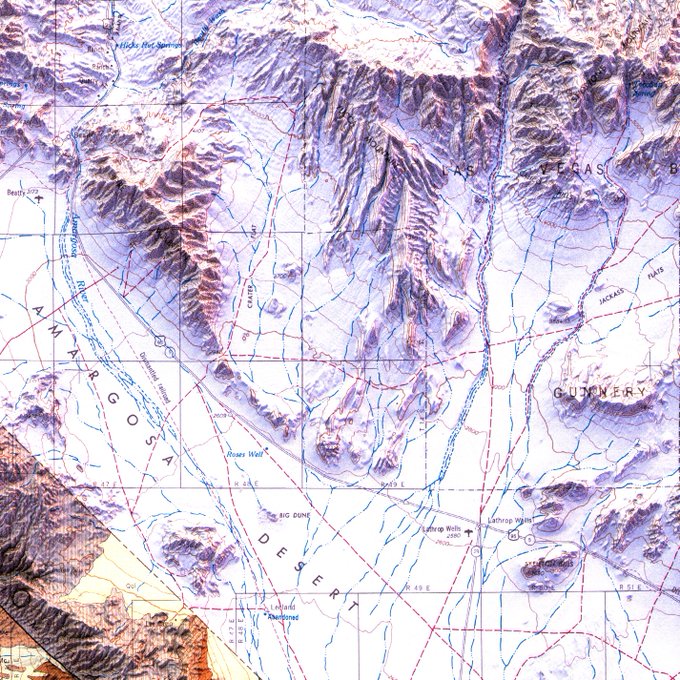
A 1969 Geologic Map of California, Death Valley Sheet, Olaf P. Jenkins Edition.
#rayshader adventures, an #rstats tale


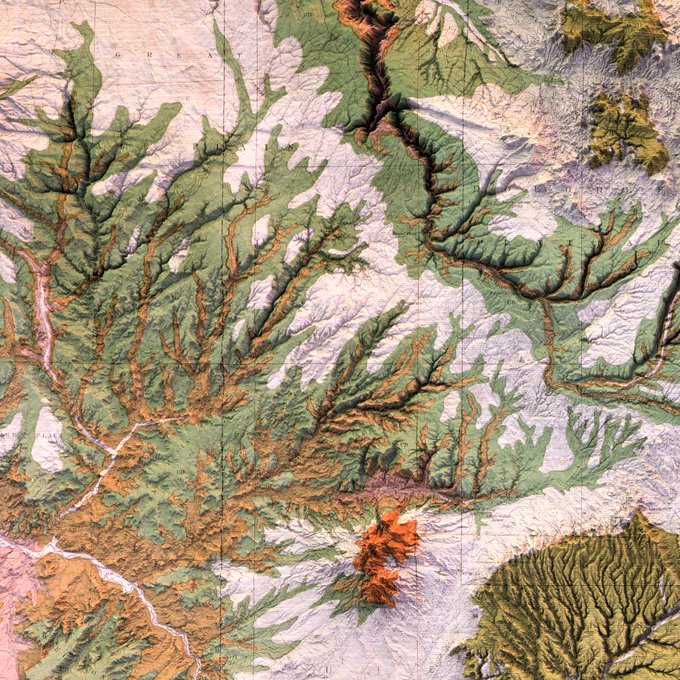
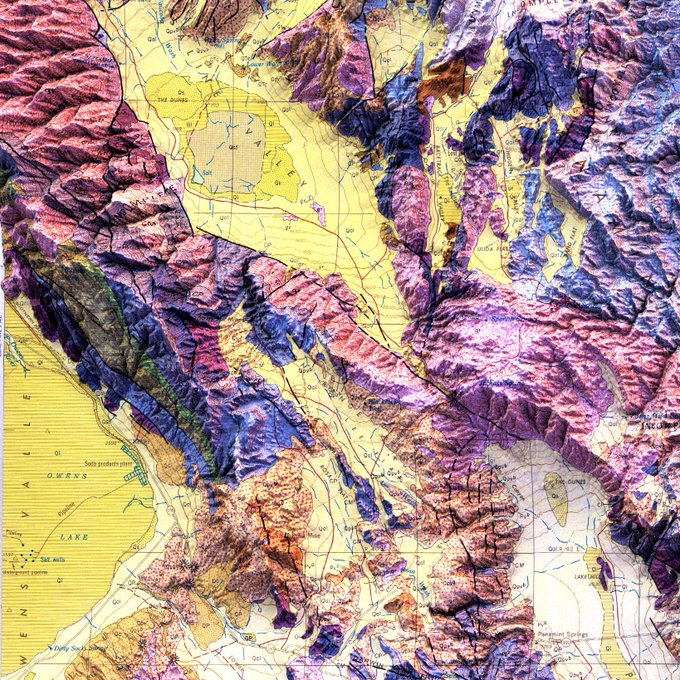
A geological map of Southwest Colorado and Parts of New Mexico, Arizona, and Utah. Surveyed in 1874 and 1875. This is the last of the series of six sheets.
#rayshader adventures, an #rstats tale

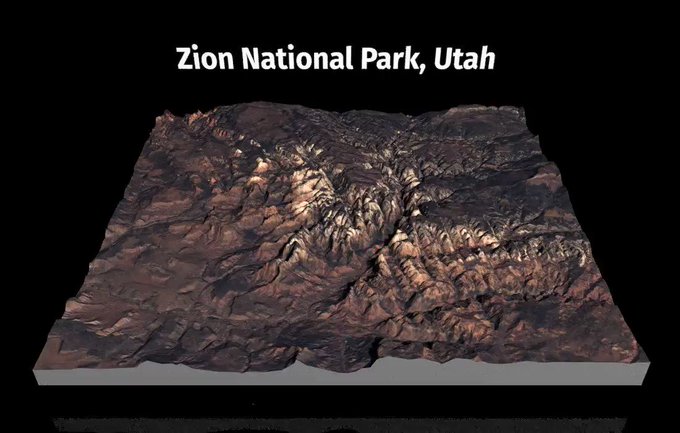
‼️NEW BLOG POST! You asked for it, and you got it!
"A Step-by-Step Guide to Making 3D Maps with Satellite Imagery in #rstats"🗺️🛰️
https://t.co/os92oLm4I7
I walk through getting the data, loading the imagery, and creating the 3D viz w/ #rayshader. All code included. #gistribe

Yes, I (sorta) can. Thanks to @djnavarro and her beautiful #rstats creations, with a wonderful write-up to boot on her blog! Do check it out.
Didn't turn out too well though... Need more practice and fiddling around with #rayshader function arguments. https://t.co/4SggOrXoAa