rstatsのTwitterイラスト検索結果(古い順)。 415 件


#machinelearning viz in Python/R https://t.co/41ejHxwUgR
via @mathinpython @cpsievert @rasbt @ML_toparticles #rstats


ENiRG: RGRASS interface for efficiently characterizing the SDMs https://t.co/yK4AjOfgO2 #rstats #niche #ecology


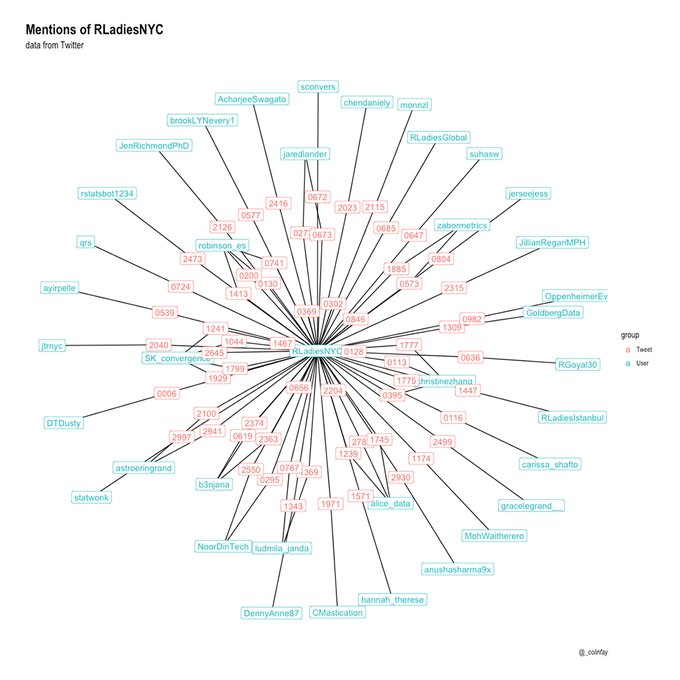
Code-through fun continues: "Introduction to ggraph: Edges" by @thomasp85 https://t.co/69VjIM5V9c #rstats #dataviz #ggraph

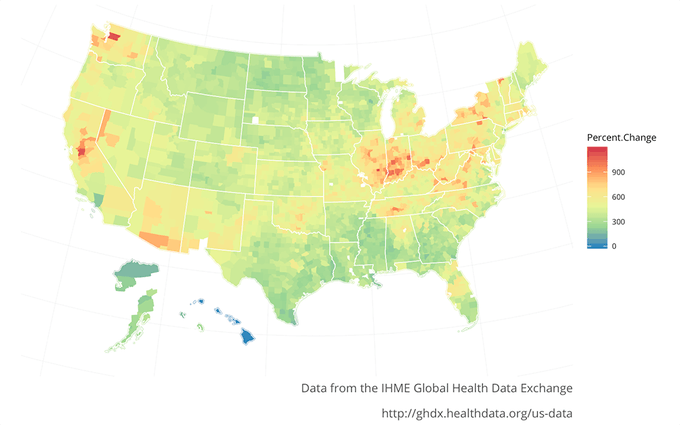
Nice li'l step-by-step from @iliablinderman: “Regional Smoothing in R” https://t.co/vCYHZBSZrB via @puddingviz #rstats #maps #dataviz


New blog post about my #JSM2017 talk on interactive graphics: https://t.co/hPheo30GcQ Featuring @ncasenmare @vihartvihart @p5xjs #rstats


Want quick intros w/ code? @anish_walia has been cranking out some 🤘 R tutorials over @datascienceplus https://t.co/OPE3031l8s #rstats


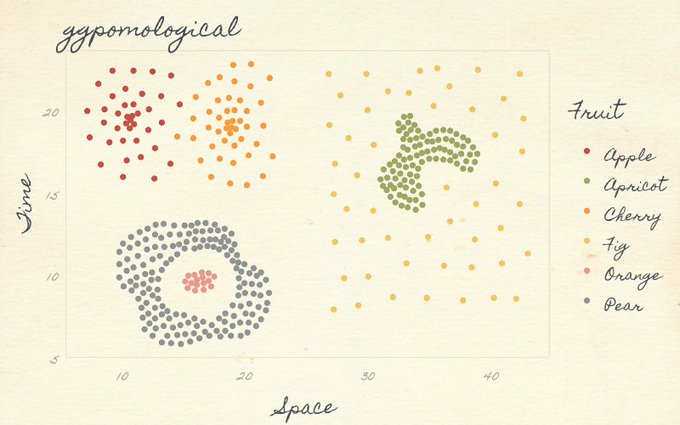


😍 pomologically-inspired plots…
"🍑 ggpomological: A Pomological ggplot2 Theme" 👨🎨 @grrrck
https://t.co/Bqj6ZibwwM #rstats #dataviz


Frankenstein #rstats #ggplot2 #maths https://t.co/FAzAiLJBg0 (w/code)

R Weekly 2018-19 pkgdown, tweets, showcase https://t.co/i2owfRIpfl #rstats


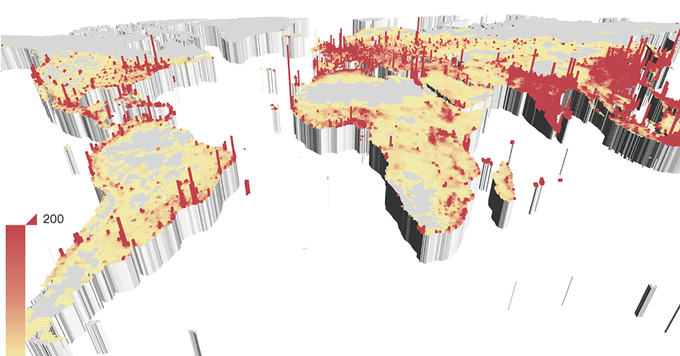
🗺 bubble grid maps w/ #rstats code:
🐄 "The Herds of Europe" ✍️ @maartenzam
https://t.co/fx7nldO8MQ #dataviz #maps


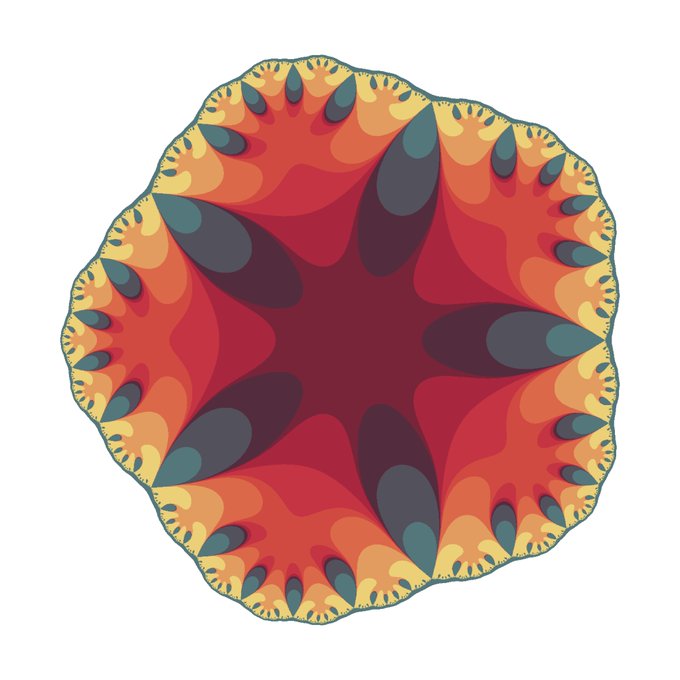
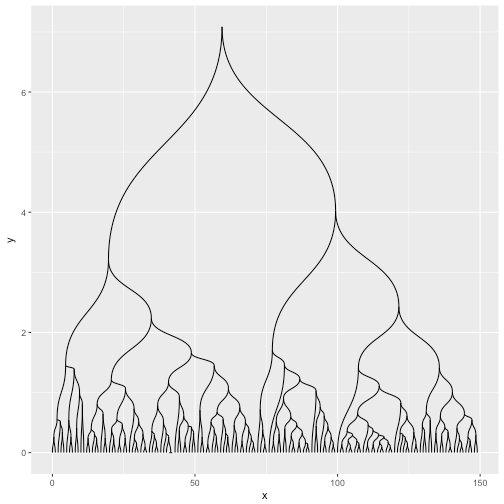
6.250.000 números complejos, transformados repetidamente y pintados con #ggplot en unos cuantos segunditos con un portátil normal y corriente #rstats #tidyverse #matematicas #creativecoding


Things that I do with some mathematics and #rstats (code available at https://t.co/CMSW65GE4l)


🤩 @allison_horst's personifyr art 🎨 is 💯 my new fave #rstats-Twitter thing! #scicomm #sciart


