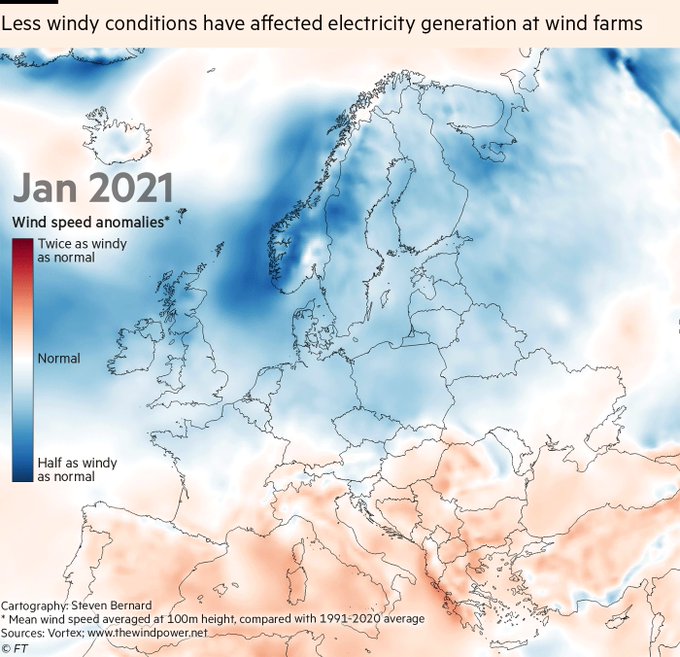
How wind anomalies and a phenomenon called 'global stilling' are affecting wind farm electricity generation.
https://t.co/zH2iYh1Zem
#gistribe #FTfreetoday
Thanks to @TheWindPower I have added another slide to the animation at the end, showing the locations of all the onshore/offshore wind farms in Europe
This week's climate graphic looks at how wind anomalies and a phenomenon called 'global stilling' are affecting wind farm electricity generation. Huge thanks to @DrPaulDWilliams & @matteodefelice for their insight and @VortexFdC @CREACleanAir for the data
https://t.co/zH2iYh1Zem
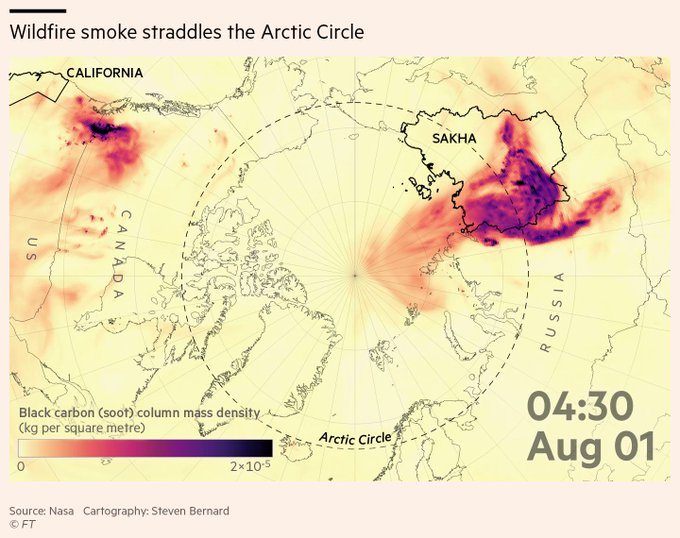
This week's climate graphic is on Siberian wildfires and how the smoke from these blazes straddled the Arctic Circle in August and led to the highest carbon emissions on record
Read @lesliehook's fascinating report
https://t.co/aAw3cZbf17
#gistribe #dataviz
This week's climate graphic looks at the record temperatures reported across the northern hemisphere on June. Data supplied by @CopernicusECMWF
Read @lesliehook's report
https://t.co/7jG1WYVfQb
#gistribe #dataviz #HeatWave2021 #ClimateCrisis
Take a trip to London's @sciencemuseum, as seen through the eyes of @FinancialTimes technical illustration maestro @ian_bott_artist. It is a visual feast of stunning artwork and a great insight into what makes him tick
https://t.co/3UUeuXghZQ
#illustration
Had a blast working with @lesliehook and @hjesanderson on this incredible long read on the transition from fossil fuels to clean energy gathering speed, and what it means for the balance of power
Thanks to @VaisalaGroup for the map data
https://t.co/RUuRFGYla0
#gistribe #dataviz
@alex_pigot @christrisos used 22 climate projections each year to 2100 to predict when ~30,000 species on land and in the ocean will be exposed to conditions consistently hotter than previously experienced across their geographic range. Results showed 7 in 10 would be affected
Absolutely stunning work from @ian_bott_artist in this fascinating article by @clivecookson and @AnnaSophieGross on how bats can help us understand immunity to the #COVID19 virus
https://t.co/VLf8Mf9F08
#dataviz
What better way* to spend a sweltering Saturday afternoon than creating a 3d-model of #Ullswater in #Blender3d, using @DefraData's #lidar download interface.
https://t.co/HNmypUNAiQ
#gistribe #mapporn
* There probably are better ways but this does it for me!


