DataScienceのTwitterイラスト検索結果。 415 件中 15ページ目

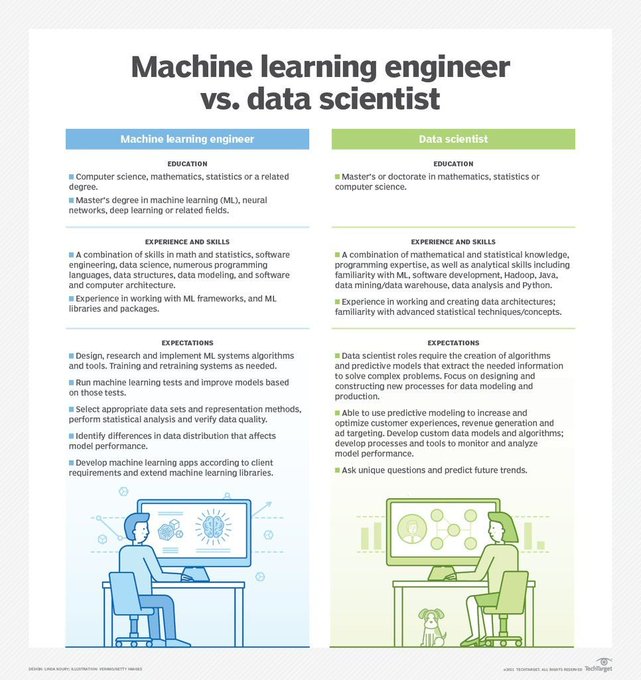


#DataScientists 🆚 #MachineLearning #Engineers 👨🏽💻
https://t.co/0pg1Xd9vbO
v/ @gp_pulipaka
#DataScience #BigData #Analytics #AI #ML #IoT #IIoT #IoTPL #Python #RStats #CloudComputing #Serverless #RPA #NLP #Coding #Programming #100DaysofCode #CodeNewbie #DEVCommunity #WomenWhoCode https://t.co/o8Yw3gyxEy


Never read your old commits#100Daysofcode #javascript #programming #dev #linux #java #programming #CodeNewbie #python #reactjs #bugbounty #DataScience #infosec #gamedev #BigData @programmerjoke9


Topography map of the greatest country in the world... Ireland. Colours correspond to the national flag obviously.
This map was made with #Python using #Numpy, #matplotlib and #Pandas. #data #DataScience #data #dataviz #DataScientist #Ireland #eu #geography #artwork #art


Contour line map showing the topography of Great Britain. Zoom in!
This map was made with #Python using #Numpy, #matplotlib and #earthpy. #data #DataScience #data #dataviz #DataScientist #uk #gb #eu #geography #artwork #art

En algún lugar de la conciencia.
#arte #art #PhotoOfTheDay #Photography #scifiart #RTXOn #javascript #DataScience #programming #100DaysOfCode #Java #Linux #Memes #art #arte #technology #gamer #Android #GamingNews #design #setup #vintage #Science #Xbox #AI #Hacking #tech #pic


🗼Massive Fishing fb 2021
https://t.co/BzituHvJTS
#UnemploymentExtension
#memories 🦃#empath #death #DataScience #MachineLearning #IoT


The Next Frontier in #AI: Nothing
#AI #DL #ML #DataScience #NeuralNetworks #bigdata #fintech @ImMBM @Xbond49 @ipfconline1 @sallyeaves @insurtechforum @mvollmer1 @HaroldSinnott @AkwyZ @SabineVdL @helene_wpli @YuHelenYu @jblefevre60 @chboursin @efipm
https://t.co/NQoDLMQB13
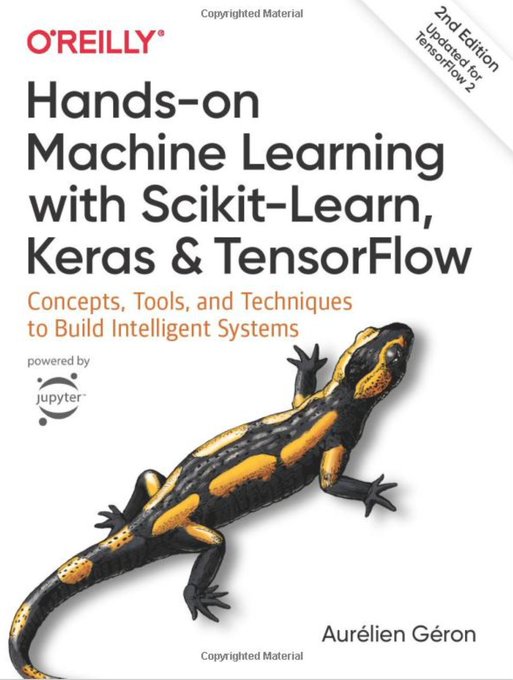

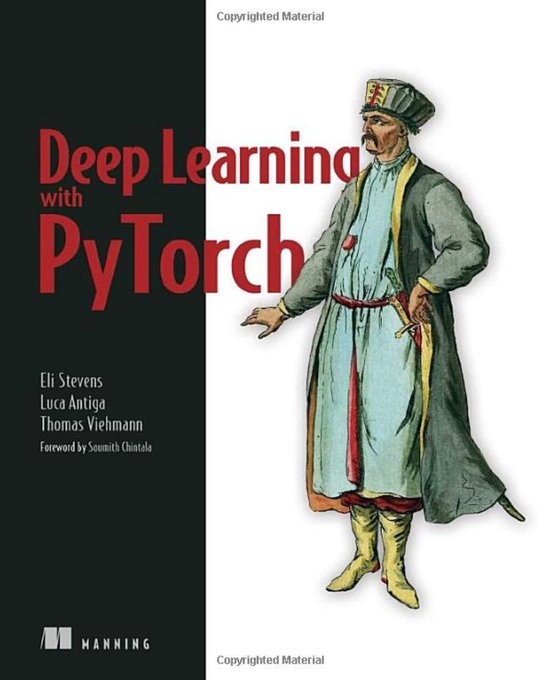

Top 7 Must Have #Books for #DeepLearning
https://t.co/f0XB9jqi7E
v/ @gp_pulipaka
#BigData #Analytics #DataScience #AI #MachineLearning #ML #IoT #IIoT #IoTPL #Python #CloudComputing #Serverless #RPA #NLP #DataScientist #Programming #Coding #100DaysofCode #DevCommunity #CodeNewbie https://t.co/gEM4Aovwac

What To Expect From Next Generation GPT-4 #AI
https://t.co/iMb6SGXBVS
@sallyeaves @pierrepinna @Xbond49 @Nicochan33 @jblefevre60 @gvalan @Shi4Tech @nigewillson @PawlowskiMario @enilev @JimMarous @SpirosMargaris
#MachineLearning #DeepLearning #DataScience #Fintech #5G


Prettymaps: #Python library for customized maps from #OpenStreetMap data
https://t.co/O2TEjX7hA1
v/ @SourabhSKatoch
#DataScience #BigData #Analytics #AI #MachineLearning #IoT #IoTPL #RStats #Serverless #programming #coding #100DaysOfCode #DEVCommunity #CodeNewbie #WomenWhoCode https://t.co/NKL0BDA0Js


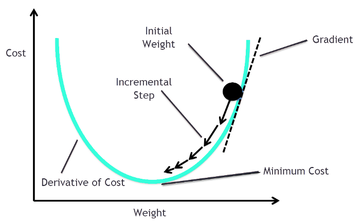

Gradient Descent for #MachineLearning 101 with #Python #Tutorial
👉🏽https://t.co/4uuUbaEdie
v/ @Analytics_699
#Analytics #BigData #DataScience #AI #ML #Serverless #CloudComputing #IoT #IIoT #IoTPL #NLP #RPA #AR #VR #QuantumComputing #programming #Coding #TensorFlow #100DaysOfCode https://t.co/eGVzVDScvJ

You ❤️ this Cyber art?
#RTXOn #art #javascript #DataScience #programming #100DaysOfCode #Java #Linux #Memes #art #arte #technology #gamer #Android #nature #gaming #photography #design #setup #vintage #Science #BigData #Xbox #AI #Hacking #tech #pic #cultura #Marketing #Tecnologia