visualizationのTwitterイラスト検索結果。 850 件中 22ページ目


My projects for @la_lettura have been nominated for the @europeandesign Awards 2021 and I’m now finalist! Thank you!
#datavisualization #dataviz #infographic #ddj

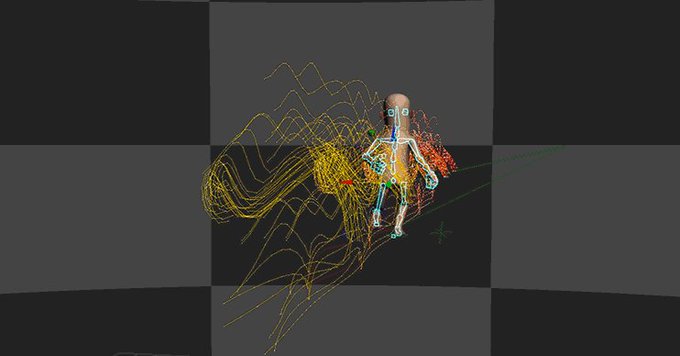
Toggled on this motion path visualization by accident, thought it looked pretty neat


The Synaptic Saber!
The man with the bladed brain! Using experimental visualization implants, this psychically projecting swashbuckler can manifest super sharp slashers on the spot! Unfortunately, being little sword-obsessed has left these powerful projections only saber related.


This photo, for me, is THE visualization of #Bittersweet
He's half smiling and in the rain 😭


Teaser Alert! In the next release of #ProteinImager there will be the ‘quantized’ style option! For those days when you feel just a little crazier than usual🤪
#sciart #visualization


Mapping the world's flight paths.
This map shows 67,663 routes between 3,321 airports on 548 airlines!
Made with #Python using #matplotlib. #DataScience #DataVisualization #Travel #travelban #Map #COVID19


More character pieces from my Visualization class this semester that I thought i'd post for fun! Here's a link to my finished pitch presentation too!! https://t.co/kW22D8JTPe


Quick drawing for the new profile picture~
(Cartoonized eyes for better visualization in the small crop)
I'll be back tomorrow with a new pic and great news!
#NewProfilePic #OC #OriginalCharacter #Art #MyArt #ArtistOnTwitter #Drawing #Cartoon #TheNeeh
...I'm really excited...


GRAPHICS DESIGN COURSE_
Work on websites, online ads, and print & publishing. Learn design & visualization for media, graphics & illustration, typography, and Image Magic with Photoshop CC. Exciting jobs are available for you.


#Computational Graphics Software for Interactive #Docking and Visualization of Ligand–Protein Complementarity
https://t.co/ev79ymbc5p
#current_issue #Pharmaceutical_Modeling


Mathematics, Psychedelics, Cybernetics.
Exploring the Mandelbrot Set is like a journey through a forest landscape, a process of discovery of new forms and species, an infinite Homeric odyssey for the 21st century. [Visualization by @suechait]

Save Your Tears Visualization
@theweeknd x @ArianaGrande
💧🌻💧

Where do the world's CO2 emissions come from? This map shows emissions during 2019. Darker areas indicate areas with higher emissions.
This map was made with #Python using #matplotlib. #DataScience #Data #DataVisualization #ClimateAction
#ClimateEmergency #carbonfootprint


31/ As mentioned earlier on in this thread, #toxiclibs was a collection of ~300 "building blocks for computational design" (for Java/Processing) & formed basis for most of my work between 2006-2011... (These visualizations were created as exercise during a workshop at @V_and_A)