ArcGISProのTwitterイラスト検索結果。 11 件


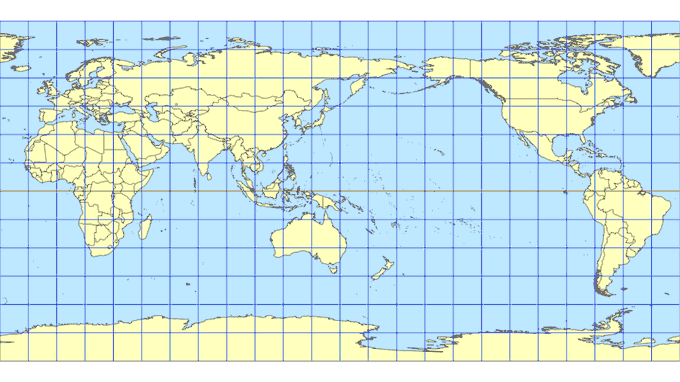


#ArcGISPro はver3.0でも #舟形多円錐図法 はサポートされていません。しかし、マップのプロパティにあるクリップ機能を使えば、ひとつのデータで12個の #多円錐図法 を並べたレイアウトが作成できます。
舟形多円錐図法はミカンの皮をむくイメージに近い図法です。
#地図投影法 #一日一図法


Geologic Map of Taiwan - Geologic Survey of Taiwan - 1953
3D render
#geology #geography #cartography #GIS #b3d #arcgispro

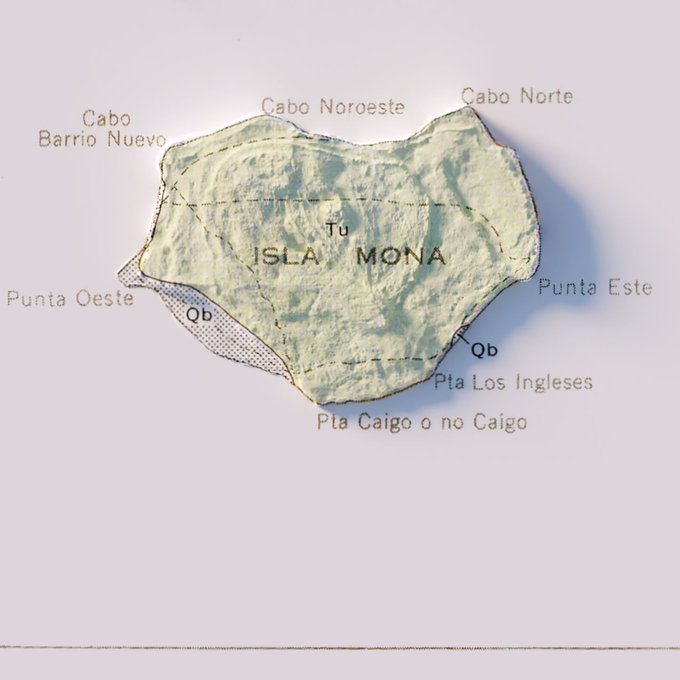

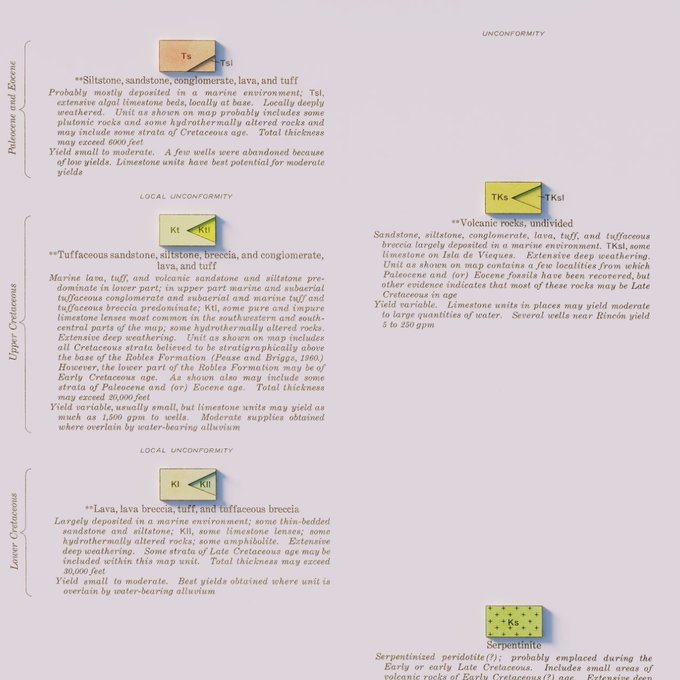
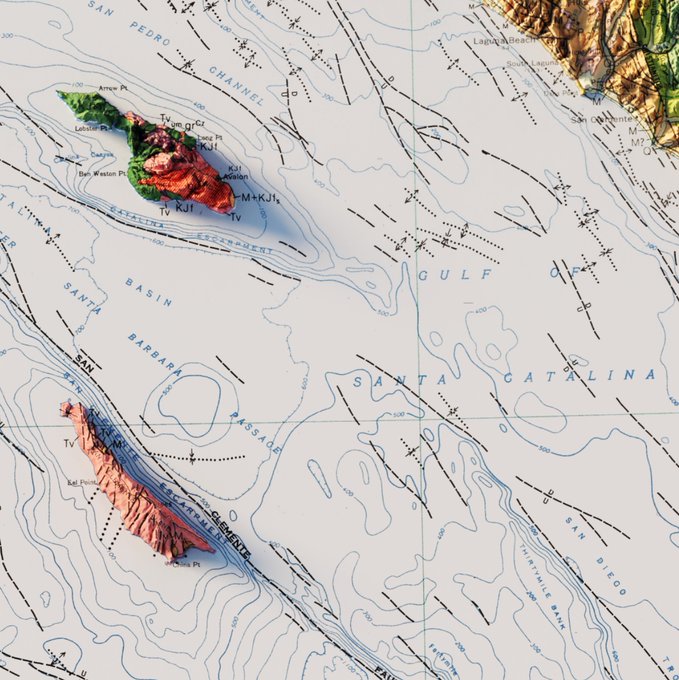
Hydrogeologic Map of Puerto Rico and Adjacent Islands - USGS - 1965
#arcgispro #b3d #PuertoRico #geology #geography #GIS #dataviz #cartography


South America - 1922 - John Bartholomew and Son - "The Times" Atlas
#arcgispro #b3d #SouthAmerica #GIS #dataviz


Geological Map of the British Islands - Based on the work of the Geological Survey - Ordnance Survey - 1939
#arcgispro #b3d #BritishIsles #Ireland #Wales #UK #Scotland #England #geology #geography #GIS


A redditor requested Italy in the same circle style. So here you go. Each circle is approx 707km².
#arcgispro #b3d #Italy #Italia #3dart


Bedrock Geologic Map of Indiana - 1987 - State of Indiana Department of Natural Resources
#arcgispro #b3d #geology #geography #GIS #dataviz


Experimenting with #ArcGISPro and #AdobePhotoshop to simulate a hand-drawn, manually-airbrushed shaded relief of #Amorgos island in #Cyclades #Greece. Sole input data the dem of the island.
#cARTography #MakingMapsPretty


Geologic Map of California - 1977
#arcgispro #b3d #California #geology #geography #gis #dataviz

Dymaxion projection render, take 2. Reduced exaggeration and tried to make it so you could actually see the sea floor.
@Esri calls it the Fuller (World) projection, but Dymaxion sounds cooler.
#arcgispro #ArcGIS #b3d


R. Ufficio Geologico - Carta geologica delle Alpi occidentali - Dedotta Dai Rilevamenti Eseguiti Gagli Ingegneri del R. Corpo Delle Miniere, dal 188 al 1906 - Roma, 1908
#arcgispro #blender #maps #gis #dataviz #geological #cartography #copernicus #geospatial #3dart #3dmodeling