
Simon Kuestenmacherさんのイラストまとめ
@simongerman600Follow @simongerman600さんをフォローする
フォロー数:215207 フォロワー数:264446


"Migrations in Motion" This map by The Nature Conservancy shows mammal (pink), bird (blue) and amphibian (yellow) animal migrations in the Americas. Source: https://t.co/Vt2r8y64mx

This map of Vesuvius from 1832 shows the routes of flows of lava across 200 years of major eruptions (between 1631 and 1831). We can also see trails, landmarks and cities. Pompeii can be seen in the bottom right corner. Source: https://t.co/rXWqnAKue2

This is the ultimate interactive Germany map. It's great fun but in German. I guess you could kinda guess your way through it if you don't speak German. Source: https://t.co/Y91BVjKpVK

Beautiful illustrated bird's eye view of the Chicago River. Source: https://t.co/64KcUINtEo

This map was created in 1823 by Alexander von Humboldt. It's the first isothermal map. Imagine creating isothermes! How cool is that! Source: https://t.co/D0vDjeYB27

Yay, another Super Mario map! This time we get to enjoy a pixelated view of Serbia. Source: https://t.co/Hdmw8a9ibI

Animation shows the difference between 10fps, 20fps, 30fps and 60fps. Source: https://t.co/OgmohOLFzL

This map shows everything England or Great Britain has ever owned, colonized, invaded, vassalized, occupied, etc. Source: https://t.co/6ZqqlDOWob

This map splits the Australian population in two. Source: https://t.co/VqhjXJXhbg
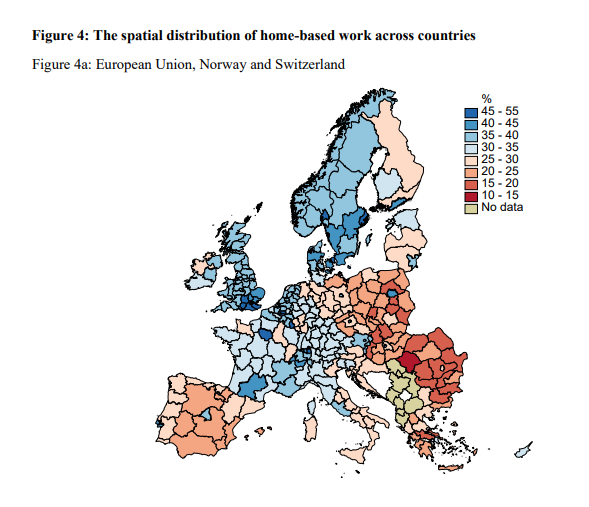
Report by @WorldBank explores who can potentially work from home. This map from the report shows the share of jobs across Europe that could be done from home. Higher income jobs are much more likely to be WFH-compatible. Source: https://t.co/T8XB94ODYN