DatavizのTwitterイラスト検索結果。 255 件中 13ページ目


Estudo de Opinião Eurosondagem S.A. para @expresso e @SIConline
http://t.co/LE1ZLVfqu3
#legislativas2015 #dataviz


This weeks most memorable #contentmarketing using good data! http://t.co/J7rbZOokEd *30th edition #dataviz #ddj

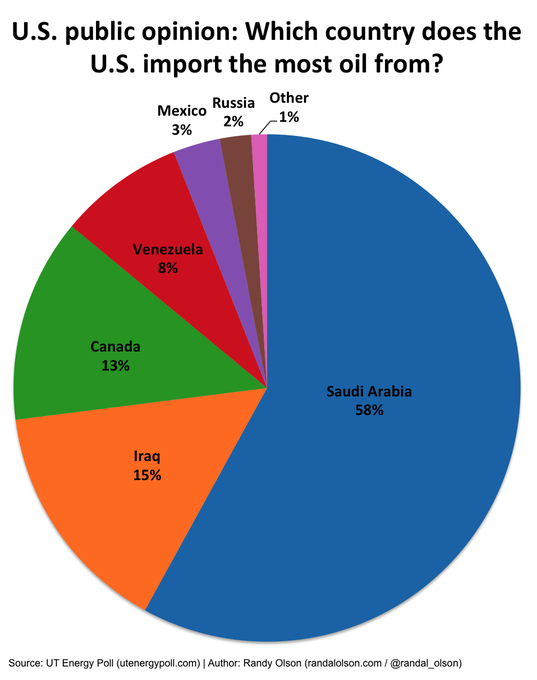
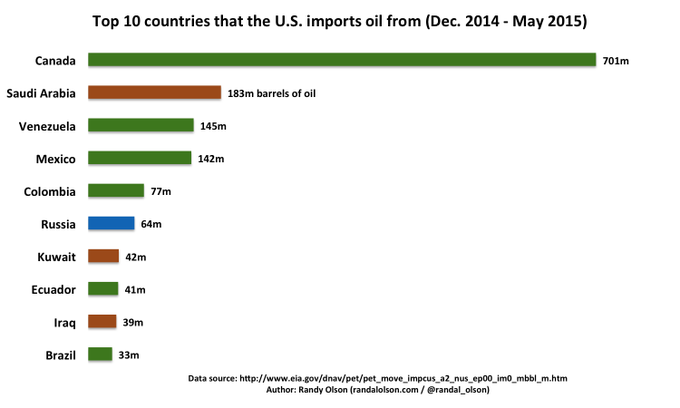

Where the US thinks its oil comes from vs. where it really comes from. #dataviz
http://t.co/clW8HhP1YR


Audio Chips (I). Generative Design.
#generative #code #processing #dataviz #audiovisual
http://t.co/OonahTX5Ls


NASA visualizes the year of Earth's CO2 emissions | http://t.co/DfehOfasaw via @abuczkowski @geoawesomeness #dataviz

Isochrone Map: Austro-Hungarian Empire Railway Network in 1912: https://t.co/CmQiCMgA11 #dataviz

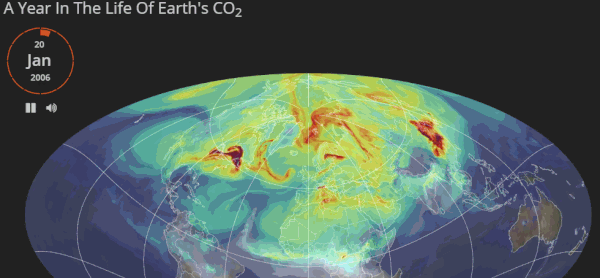
Very nice: one year life cycle of #CO2 by @OSUCartoGroup & @NASA http://t.co/1t4qvkQHg1 #dataviz


@eleanor_lutz breathes life into science infographics using GIF's http://t.co/PSpwrUhy7P #NatHist #dataviz


Comet #67P Chury as interactive web page
https://t.co/SWVYTMnzbg
#Blender #b3d #webgl #3d #Blend4Web #dataviz

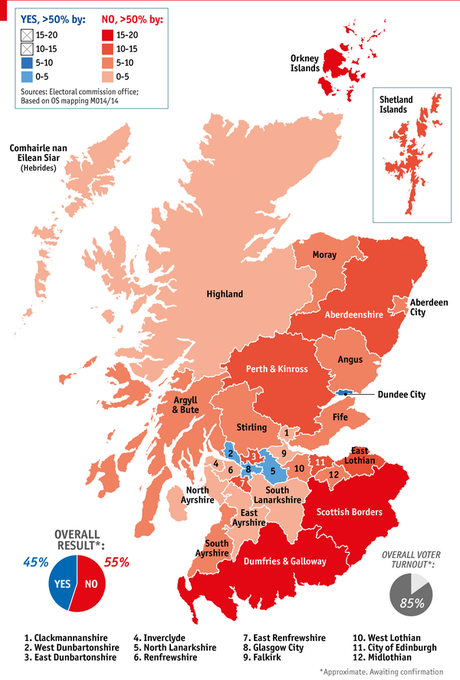

"How Scotland voted" w/ and without areas resized - #georef #dataviz via @randal_olson and http://t.co/nZQATaJFgk


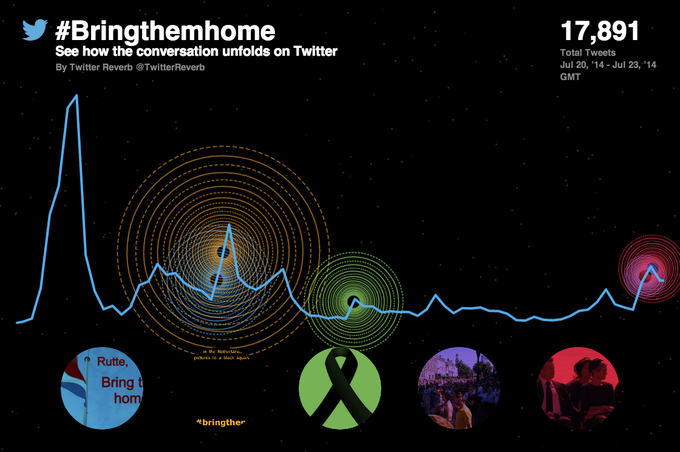
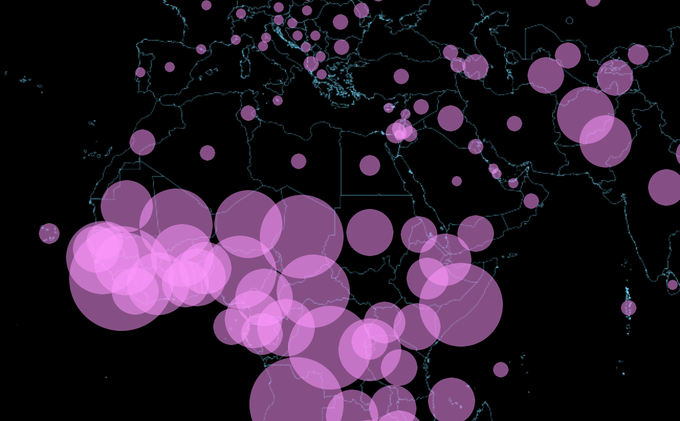
How we made a new #dataviz tool for showing Twitter conversations
http://t.co/Y2SBqhxiQv

#dataviz 90 million lives saved just since 1990 - @gatesfoundation http://t.co/JXIA4JYU7R

Popularity of #college degrees over the past 40 years.
Source #dataviz: http://t.co/Z3tk33fymF #education


A Mondrian-esque "Chromatographic Chronicle" from 1864. More here: http://t.co/Bexe7DS30I #dataviz