Mapping the world's flight paths.
This map shows flight paths in 2022 and was derived from ADS-B data.
Made with #Python using #matplotlib and #Numpy. #DataScience #DataVisualization #Map #shipping #Geography #dataviz #data #DataScientist
Topography map of the United Republic of Tanzania.
The colormap goes black-green-blue-yellow from low to high altitudes.
This map was made with #Python using #Numpy, #matplotlib and #Pandas. #Data #DataScience #dataviz #geography #artwork #art #Tanzania
Population density of the British Raj if it existed today. The dark spots represent cities, can you name them all?
This map was generated with #Python using #Matplotlib, #Numpy and #Pandas.
#Data #DataScience #dataviz #geography #Humanity
Topography map of France. Colours correspond to the of the national flag. #TopographyTuesday
This map was made with #Python using #Numpy, #matplotlib and #Pandas. #data #DataScience #data #dataviz #DataScientist #eu #geography #artwork #art #France #Map
Topography map of Kenya. Colours correspond to the of the national flag. #TopographyThursday
This map was made with #Python using #Numpy, #matplotlib and #Pandas. #data #DataScience #data #dataviz #DataScientist #eu #geography #artwork #art #Kenya #Africa #Map
What does the world really look like? As we all know the earth is flat so here is the map of the world that we should be teaching in schools. Day 28 of the #30DayMapChallenge - #Python #Numpy, #matplotlib #. #data #DataScience #data #DataScientist #icewall #FlatEarth #sheep
Where do the world's CO2 emissions come from? This map shows emissions during 2019. Darker areas indicate areas with higher emissions. Day 27 of the #30DayMapChallenge This map was made with #Python / #matplotlib. #DataScience #Data #DataVisualization #ClimateAction
#Climate
3D digital elevation model of Taiwan for day 19 of the #30DayMapChallenge - Islands.
This map was made with #Python using #Numpy, #matplotlib and #earthpy. #data #DataScience #data #dataviz #DataScientist #geography #artwork #art
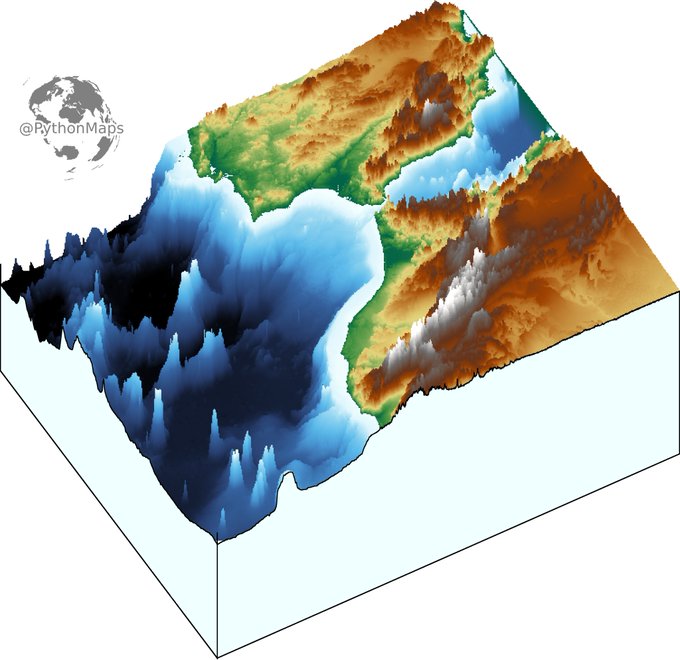
3D digital elevation model of the strait of Gibraltar for day 11 of the #30DayMapChallenge .
This map was made with #Python using #Numpy, #matplotlib and #earthpy. #data #DataScience #data #dataviz #DataScientist #eu #geography #artwork #art #Gibraltar #Brexit
In honor of #COP26 here is a map of the worlds #carbon dioxide emissions in 2020. In terms of raw numbers it looks like the #USA, #Europe, #China and #India really need to come to an agreement.
#ClimateAction
#ClimateEmergency #carbonfootprint


