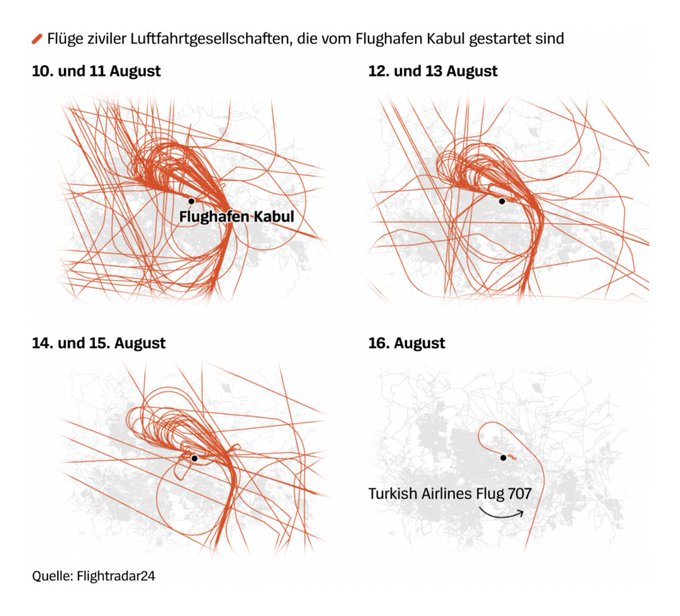
datavizのTwitterイラスト検索結果。 366 件中 5ページ目


Been playing with adding more than a dozen different color palettes to my Spirograph program over the past week. Here’s a peek at “antique”, “popsicle”, and “dark rainbow” (the latter being a palette which I use in my (dataviz) visuals for years now (not sequentially))


Great collection of interesting, recent visualizations.
Data Vis Dispatch, August 31 by @Datawrapper
https://t.co/BQpFvl8xdZ
#dataviz #statistics


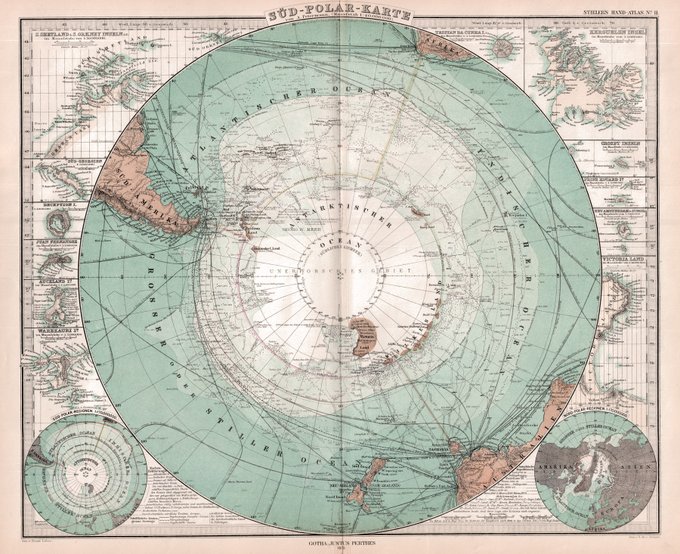
The frontier of the distant southern polar continent with notations for explorers routes, and surrounded by all those far flung islands of the nearby oceans. #oldmap #maps #dataviz #Antarctica


Join us next Tuesday for an @observablehq livestream about making waterlines in #Maps
⏰ Tues 27 July 5pm (UTC+1)
📍https://t.co/cEt69zA5Ae
#DataViz #Design
#DigitalHumanities #CulturalHeritage #MuseTech https://t.co/xtf5pWD6sc


This week's climate graphic looks at the record temperatures reported across the northern hemisphere on June. Data supplied by @CopernicusECMWF
Read @lesliehook's report
https://t.co/7jG1WYVfQb
#gistribe #dataviz #HeatWave2021 #ClimateCrisis


Thanks for the nice feedback, everyone! The second dispatch came out yesterday, full of interesting charts & maps: https://t.co/0OLwpNMDYs
(If you know where we can find great #dataviz from Asian/African newsrooms, please let us know. We'd love to make it more international.)


South America - 1922 - John Bartholomew and Son - "The Times" Atlas
#arcgispro #b3d #SouthAmerica #GIS #dataviz


Had you told @DataRevelations 4 years ago that he would advocate building a dashboard by committee he would have said you were crazy. Find out not only what changed his thinking, but also how he learned to make better, faster #dataviz working with others. https://t.co/PHdXXuJwge


New week, new release, new chart, new feature
🥳🥳🥳🥳🥳🥳🥳🥳🥳🥳
We have just released an updated version of RAWGraphs with:
- voronoi diagram, horizon graph and parallel coordinates
- new data samples
- links to the tutorials for all the charts
Enjoy! #dataviz #opensource


My projects for @la_lettura have been nominated for the @europeandesign Awards 2021 and I’m now finalist! Thank you!
#datavisualization #dataviz #infographic #ddj

#FromTheArchives : Spatial Data Archaeologist, @wallacetim, draws inspiration from mapping things that no one has seen before. @colemanrharris presses Tim about his artistic process and the dreaded question of whether he prefers print or digital. https://t.co/BjG8eqD1YH #dataviz


Data analysis.
(Throwback cartoon)
Follow for more cartoons!
#Data #dataviz #DataScience #DataAnalytics #DataScientist #DataMining #whatpeoplelike #comics #comicstrip #webcomic #webcomics #cartoon

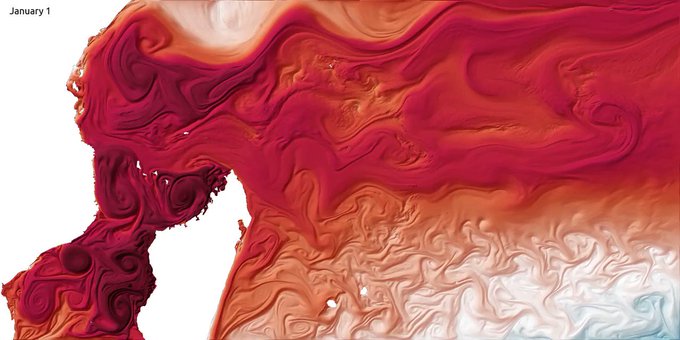
One year of sea surface temperature in the southwestern Indian Ocean. #dataviz
Source: https://t.co/8wQjYqXc6J

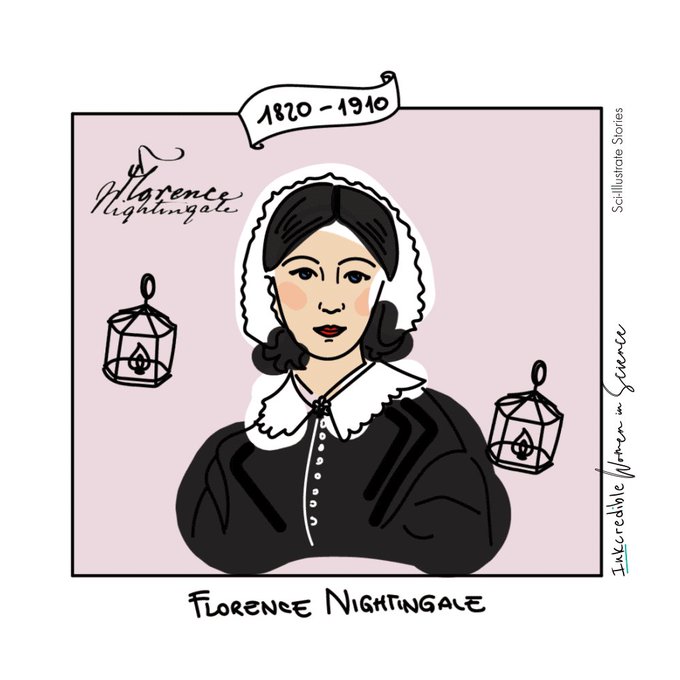
A nurse, social reformer and #dataviz pioneer. Re-discover the story of Florence Nightingale in our new #INKcredibleWIS post.
https://t.co/4ascEZkvFa
Illustration+post @Ele_AdamiAnimation
Set in motion by @RadhikaPatnala
Sci-Illustrate Stories


1/ Since '93 I've been working hands-on (concepts ⇄ IXD/UX ⇄ datamodels ⇄ front/back/devops ⇄ fabrication ⇄ hardware): web, generative design/audio/DSP, dataviz/database/semweb, museum/art/tradeshow/light installations, architecture, branding, games, print, dozens of collabs


On me dit dans l'oreillette que c'est #PortfolioDay
#print #branding #illustration #dataviz #infographies #isométrie #map #carte


Bedrock Geologic Map of Indiana - 1987 - State of Indiana Department of Natural Resources
#arcgispro #b3d #geology #geography #GIS #dataviz