datavizのTwitterイラスト検索結果(古い順)。 366 件


A Mondrian-esque "Chromatographic Chronicle" from 1864. More here: http://t.co/Bexe7DS30I #dataviz


Popularity of #college degrees over the past 40 years.
Source #dataviz: http://t.co/Z3tk33fymF #education

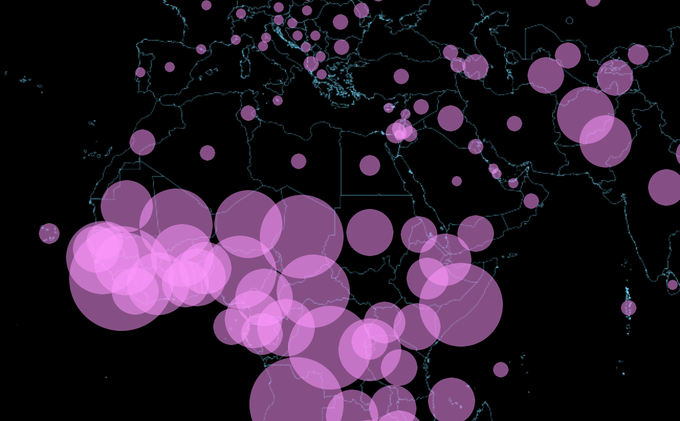
#dataviz 90 million lives saved just since 1990 - @gatesfoundation http://t.co/JXIA4JYU7R


Germany vs Argentina in data since 1958 #DataViz #infographics - (via @edenspiekermann)


Presenting our digital catalogue on historical cartography and the origins of #dataviz : http://t.co/VR1umEY6wI


Cool twitter gender #dataviz and nice piece on patterns discovered by @riblah: http://t.co/Ov9e2aAH6Y


I reworked on my temperature anomalies visualization! http://t.co/VVrBZdni4c #WebGL #dataviz #remix

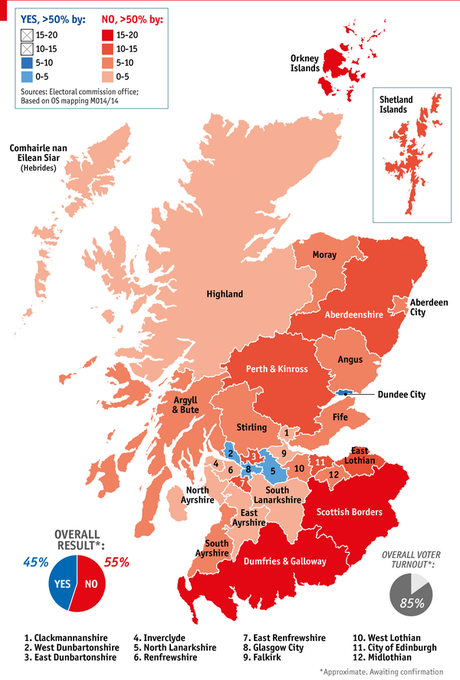

"How Scotland voted" w/ and without areas resized - #georef #dataviz via @randal_olson and http://t.co/nZQATaJFgk

The World #Religion Tree. #dataviz
Full size: http://t.co/0fVR62g4aq #dataviz


Comet #67P Chury as interactive web page
https://t.co/SWVYTMnzbg
#Blender #b3d #webgl #3d #Blend4Web #dataviz


@eleanor_lutz breathes life into science infographics using GIF's http://t.co/PSpwrUhy7P #NatHist #dataviz


A final mention for this post where I encourage you to make grey your best friend in #dataviz http://t.co/ZVh0hLjcTB


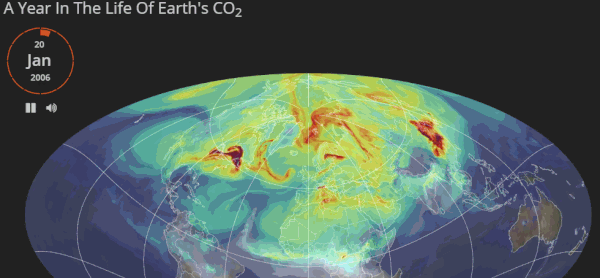
Very nice: one year life cycle of #CO2 by @OSUCartoGroup & @NASA http://t.co/1t4qvkQHg1 #dataviz

Isochrone Map: Austro-Hungarian Empire Railway Network in 1912: https://t.co/CmQiCMgA11 #dataviz


NASA visualizes the year of Earth's CO2 emissions | http://t.co/DfehOfasaw via @abuczkowski @geoawesomeness #dataviz


Amazing @wikipedia galaxy of articles http://t.co/TKnMzsPuht made with #WebGL #javascript #threejs #art #3d #dataviz

A comprehensive #dataviz of profanity in rap - who has the dirtiest mouth?
http://t.co/ai42iZOyiS