30daymapchallengeのTwitterイラスト検索結果。 75 件中 2ページ目


#30DayMapChallenge Day 24: Historical map.
Very quick map of Middle Haast from NZ Heritage Maps. Historic map draped over relief shading. Made using QGIS and GIMP.
Data from:
https://t.co/HJ8GKepDNW
https://t.co/8BiG8wXYwc


#30DayMapChallenge day 21 - elevation. I hadn't used Blender in about four years, so decided to do something with it. Turns out in the intervening years, @domlysz released the GIS add-on, and it's amazing! Here's Mount St. Helens, slightly exaggerated.


#30DayMapChallenge Day 21: Elevation by Freya Cooper features the #CuillinHills in Isle of Skye, highlighting that the Red hills of granite to the east are rounded with fewer tall ridges, whereas the Black hills comprised of gabbro are steeper and more angular.


Day 20 of #30DayMapChallenge 2021 – Movement
My (short) season skiing at @MtHutt ski field.
Each light is a separate day of skiing, recorded with @slopesapp/@Strava and imported into @Blender #b3d with the BlenderOSM add-on.


3D digital elevation model of Taiwan for day 19 of the #30DayMapChallenge - Islands.
This map was made with #Python using #Numpy, #matplotlib and #earthpy. #data #DataScience #data #dataviz #DataScientist #geography #artwork #art

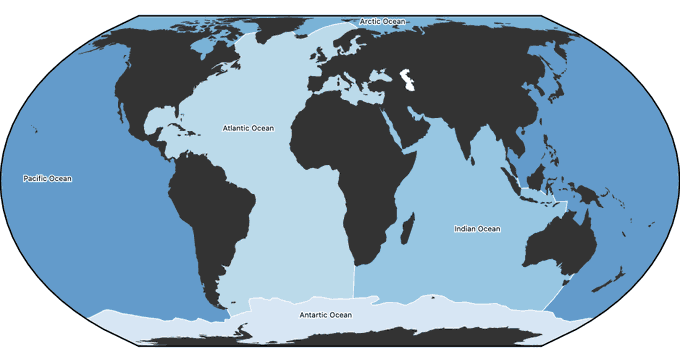
Day 18. Water. Five Oceans topojson
because I couldn't find this on the internets
https://t.co/bytvaonzZZ
#30DayMapChallenge

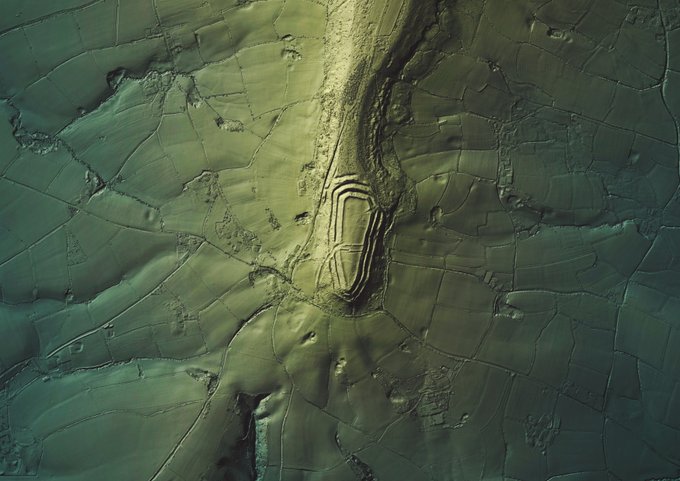

#30DayMapChallenge - 17 and #HillfortsWednesday in one today😉. Render of the impressive #Neolithic/ #IA #enclosure of #Hembury (on the edge of the #BlackdownHills in #EastDevon) and surrounding landscape from @EnvAgencyGeomat #LiDAR > #QGIS & #GIMP. #Hillfort photos below 1/n >


Southern Uplands
[SW Scotland with sea level raised to highlight upland areas. Made in Blender]
#30DayMapChallenge | Day 17 | Land


#30DayMapChallenge 2021 🗺️ Day 13 - Natural Earth Data Challenge
This is a recreation of my recreation of a map by Minard
(https://t.co/aq1acELPa0) using NE data
Tools: #rstats ({roughsf},{sf})
HighRes: https://t.co/NrQAv9NMPe


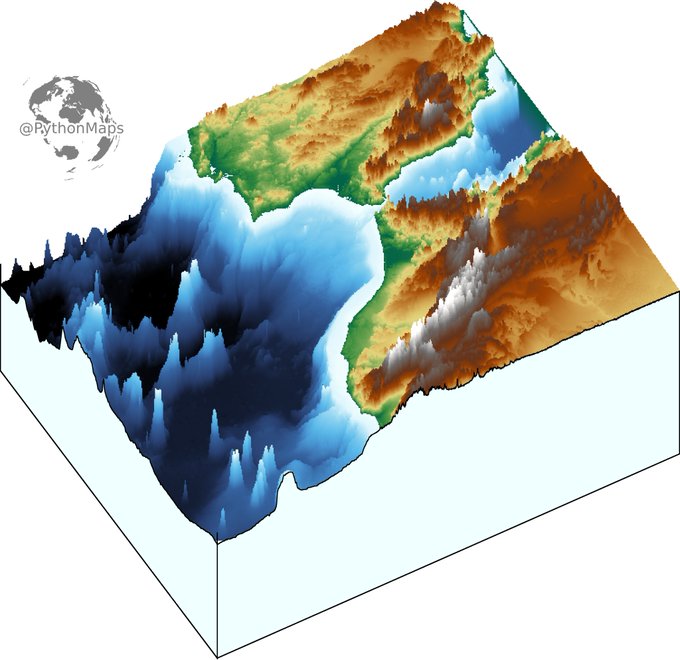
3D digital elevation model of the strait of Gibraltar for day 11 of the #30DayMapChallenge .
This map was made with #Python using #Numpy, #matplotlib and #earthpy. #data #DataScience #data #dataviz #DataScientist #eu #geography #artwork #art #Gibraltar #Brexit


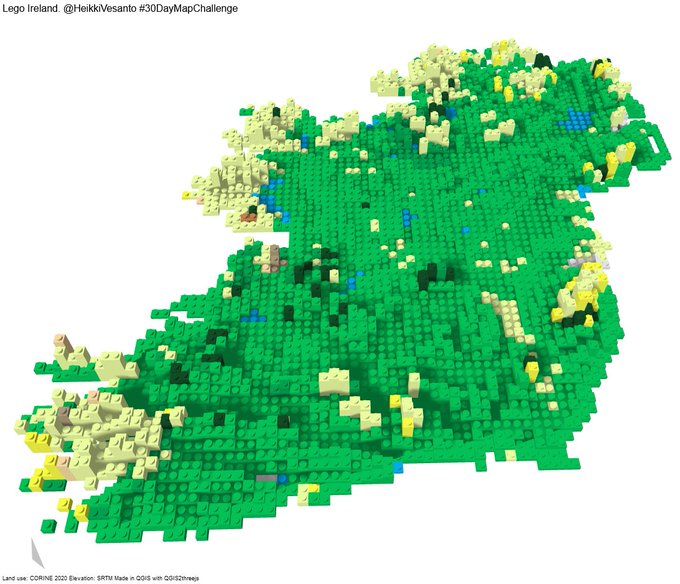
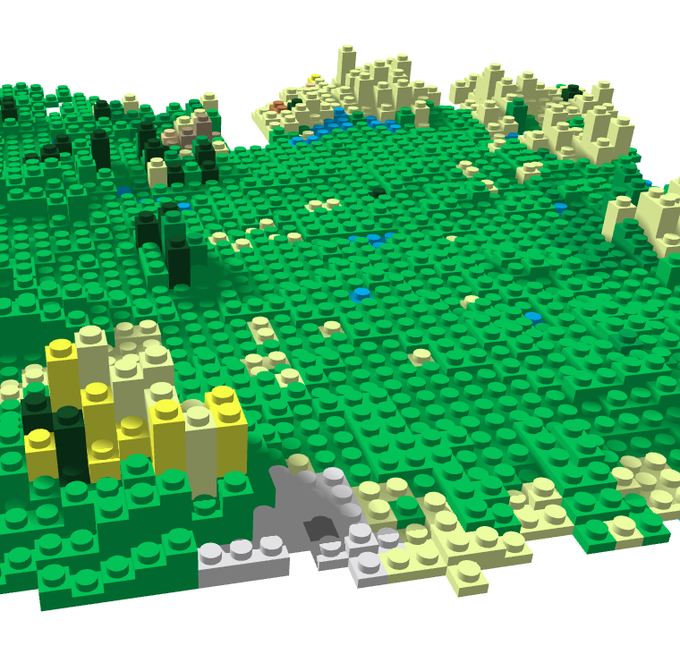

#30DayMapChallenge Day 11 "3D" - Lego Ireland
Created in #QGIS with QGIS2threejs.
Interactive: https://t.co/6nKNceVSAT
Elevation from SRTM and land use from CORINE.


#30daymapchallenge #day11: 3D
Je recycle car pas trop de temps et rebondis sur le post de @jmviglino sur les Ecrins dont je fournis une zone ici. Puis j'ajoute un medley de choses faites récemment, d'après @GallicaBnF.
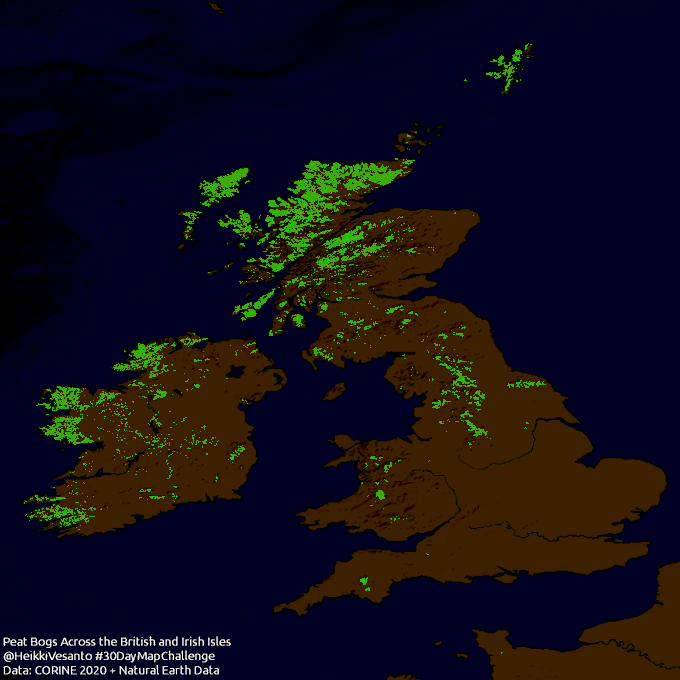
#30DayMapChallenge Day 10 "Raster"
Peat Bogs Across the British and Irish Isles.
Data: CORINE Land Cover 2020


Just wanted to show off my topographic style👀 #topography #30DayMapChallenge #artwork #digitalart


Hello #rstats, #rspatial! I implemented a package that allows to draw sketchy maps based on any type of sf object! May come in handy for #30DayMapChallenge experiments🙂https://t.co/F8u7zXHkYk


#30DayMapChallenge day 5 - OpenStreetMap!
I map a heatmap of Chinese restaurants in NYC. restaurant data extracted from @openstreetmap via the Overpass API, mapped in @LeafletJS w/ the Leaflet.heat plugin. tiles are @StadiaMaps
