qgisのTwitterイラスト検索結果。 39 件中 2ページ目


QGISを使えば自作等高線からでもDEMを生成し、地形3Dモデル構築可能であることに、フト、気が付きました。早速10数本の等高線で谷中分水界を書き3Dモデルにすると、なんと、立体像ができました。感動・感激。価値の大きなスキルです。https://t.co/iOAqMXaJ81


有吉北貝塚前期土製耳飾(11点、全部玦状耳飾)の分布図を作成しました。そのために3種グリッド分割図をQGISに貼り付けし、それらの視認補助資料を作成しました。これで今後グリッド番号から位置が即特定できます。分布図作成の効率化。https://t.co/KVshadqylR


Illuminated contours (Tanaka contours) are now available in QGIS styles library : https://t.co/i6kaRn3nFJ.
For further info, check also my post at https://t.co/3jnf6LdX4a
#QGIS


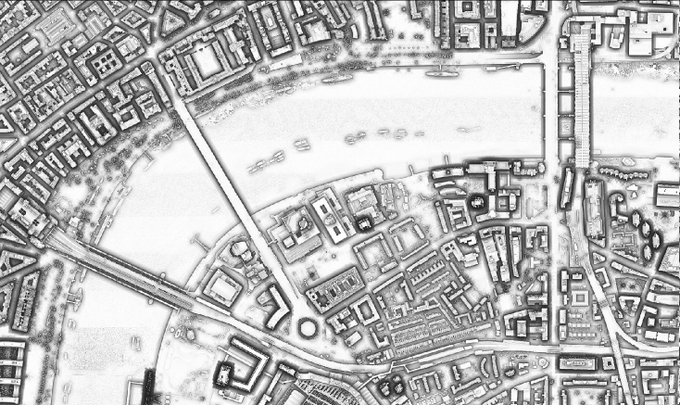
🎨 I mapped my neighbordhood in the style of an artist
👉Can you guess who❓
🔴No SVG
🎁Only OSM Data
🌟Only Geometry Generators (and @qgis)
Location : https://t.co/auHtgw1moj
#OpenStreetMap #madewithqgis #gischat #QGIS #cartography


#30DayMapChallenge.. Day 27 Non geographic. Einstein Island. Created z-depth heightmap from model in #b3d, used #qgis for the carto styling


New administrative divisions of Ukraine after 2020
#30DayMapChallenge Day 15: Connections
#QGIS Data: #OpenStreetMap contributors, personal


#30DayMapChallenge ~ Connections
Very quick map today displaying a traditional topic: Worldwide Subamarine Cables. Done in QGIS width data from Global Bandwidth Research Service


#30DayMapChallenge day 3 – polygons.
Voronoi polygons showing the nearest (linear distance) tube station for each point in London.
Data: ©OpenStreetMap contributors
Tool: QGIS


#30DayMapChallenge Day 2: lines
I used data from @WFP and #QGIS to visualise global railways. I think the data comes from OpenStreetMap, the American Digital Cartography and Global Discovery.
More info in https://t.co/3MNh9EKe0r


関東平野の色別標高図(QGIS・地理院DEMを処理)。
0-24m に色を付けてみたのですが、驚くほど広い範囲が入りますね。
色を見ると、現荒川河川敷や利根川河川敷の上流のほうは、土砂がたまって、周囲より高くなりつつあるように見えます。


Thinking about future outings, so I've had a quick look in the #TamarValley and it seems there's plenty to keep me busy - this is just a small section (nr Milton Abbot) for #HillfortsWednesday. Fancied a bit of straight up #cartography this time, so this is all in #QGIS.


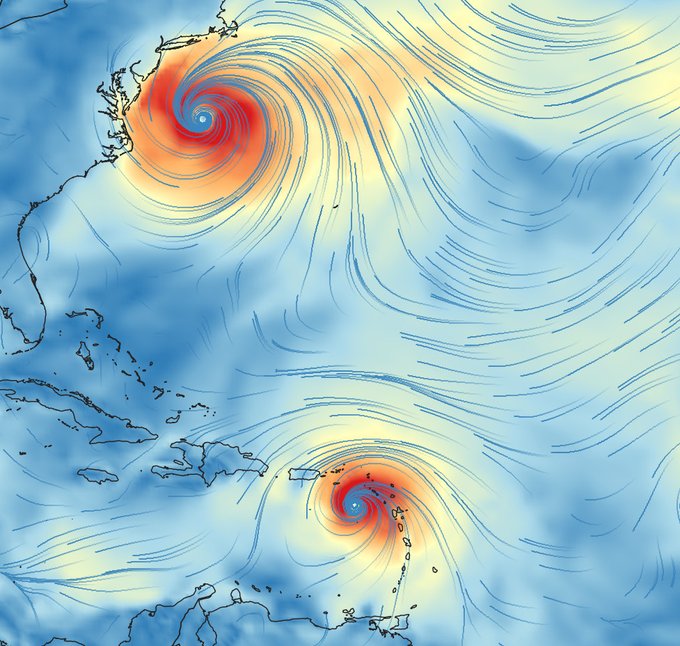
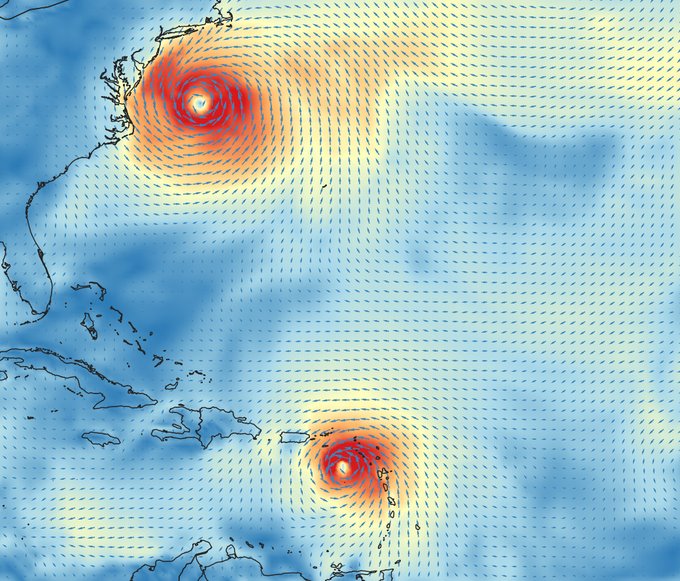
Playing w/ the new options for Mesh vector styling in #QGIS. You can choose between arrows, streamlines and traces. Streamlines and traces are wicked cool! Thanks @lutraconsulting
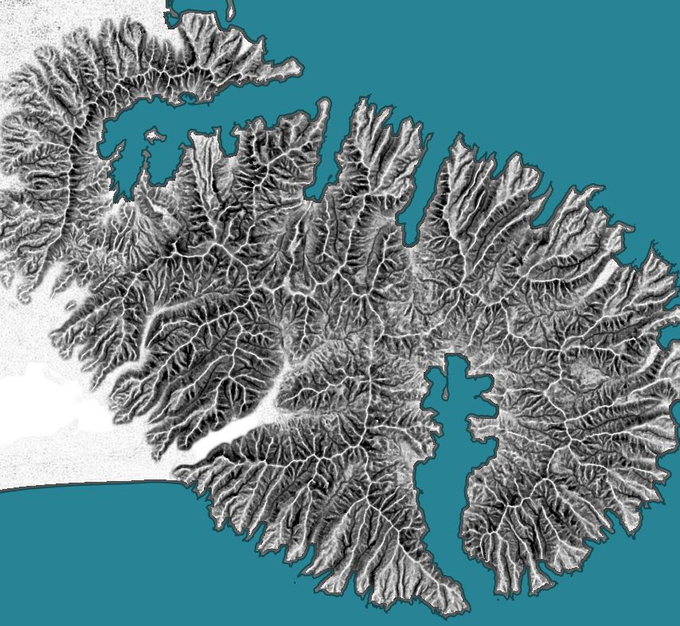
I've just uploaded a new version of QGIS Terrain shading plugin. We can now model ambient occlusion effects, which is sweet: see figures. The plugin is still experimental, please report issues you might encounter.
#QGIS
https://t.co/qEurtrXvp8


ふと思い立って気象庁の数値予報モデル(MSM)の雲量データをQGIS上に描画してみた。
0-39時間後まで1時間毎に演算されているのでアニメーションとかしてみたくなる。


Brent Hill, South Brent #SouthDevon #HillfortsWednesday.
Lots going on on this little hill.
Early #IronAge #hillfort
#Prehistoric artefacts & enclosures
#Medieval chapel & lynchets (NE)
~16thC beacon
~19thC #adit, 19thC & 20thC quarries.
@EnvAgencyGeomat #LiDAR>#QGIS>#b3d>#GIMP


Have you read my blog? Step by step guides on using #QGIS for #dataviz: https://t.co/TbCpq6zcRA
As recommended by some of Europe's finest dataviz tweeters: @maartenzam @tjukanov @charley_glynn
More posts coming soon!