datavizのTwitterイラスト検索結果。 255 件中 3ページ目


By talking about concepts like visual grammar, statistical literacy, and data ethics, we hope to help people look at data more critically and start a conversation (and if it gets more people interested in dataviz, that’s a bonus)!

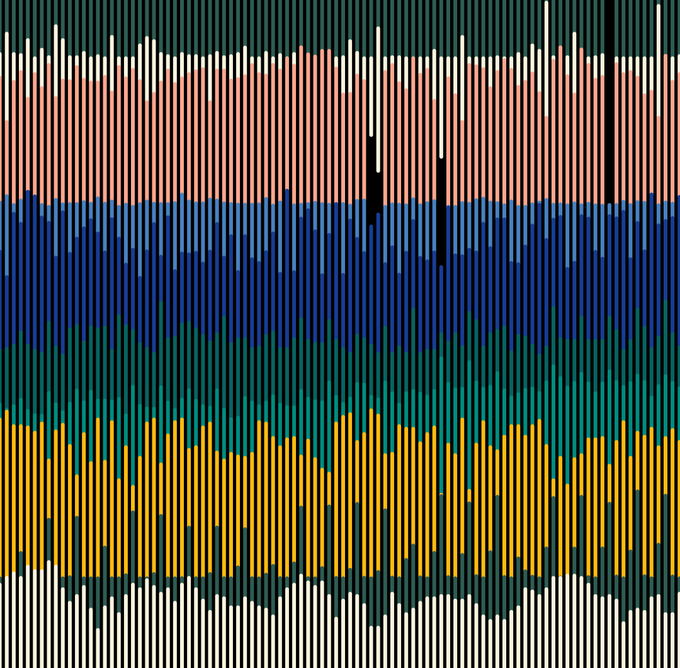
Prompt #22 - Genuary 2022: Make something that will look completely different in a year. Abstract animated visualization of Quality Air data in 2021 (SO2, FL_SO, NO2, O3, ...) from a station near home.
#genuary2022 #generative #generativeart #dataviz #p5js #ClimateCrisis #data


Piero della Francesca’s works — my latest data visualization designed for @La_Lettura: https://t.co/btAWL0beDh
#Datavisualization #dataviz #infographic #ddj


A blend between generative art and #dataviz using neural networks.
#genuary #genuary2022 #AI


This is an interesting piece of "chart of history". "Synchronized map of the History of Hungary" by the engineer Gyula Rakksányi after "his own idea" in 1879. The lengths of the reign of the kings are drawn as rivers in the "stream of time". #dataviz #timeline #historicaldataviz


Being obsessed with visual metaphors for years, I've slowly developed this brainstorming process to help come up with them faster for #DataViz, illustration, and infographic projects: https://t.co/fSqamgzIXX


Topography map of France. Colours correspond to the of the national flag. #TopographyTuesday
This map was made with #Python using #Numpy, #matplotlib and #Pandas. #data #DataScience #data #dataviz #DataScientist #eu #geography #artwork #art #France #Map


My new project is out! It’s a data visualization on Piero della Francesca’s works, designed for @La_Lettura. It’s in newsstands in Italy this week!
https://t.co/G0MW5xyCxG
#datavisualization #dataviz #infographic #ddj


#keplergl is a great tool when you want to quickly graph a geographic dataset without any code! 🔥
Just upload your CSV, Json or GeoJSON!
👉 https://t.co/pepFoSlgna
#geospatial #DataScience #dataviz


I don't have the coding skills to participate in #genuary2022 but I'm loving the submissions, learning so much new stuff and getting great #datavizinspiration. Today is all about Sol Lewitt's Wall Drawings - I'd never heard of him before but I absolutely love this!

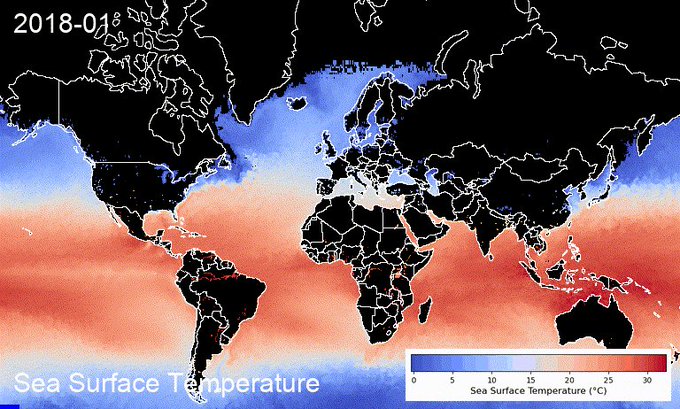
Happy New Year🎆 You can now create sea surface temperature timelapse with a colorbar using the #streamlit web app in <60 seconds 👇
App: https://t.co/LpcKK9yI6p
GitHub: https://t.co/ufznWiTnvs
#EarthEngine #geemap #eochat #gischat #oceancolor #dataviz #geospatial

Topography map of Kenya. Colours correspond to the of the national flag. #TopographyThursday
This map was made with #Python using #Numpy, #matplotlib and #Pandas. #data #DataScience #data #dataviz #DataScientist #eu #geography #artwork #art #Kenya #Africa #Map

I'm not rounding up my fave 2021 vizzes this year, but I do want to shout out the IMPRESSIVE work that Kontinentalist @konti_sg is doing. Their reporting is interesting and includes gorgeous illustrations and #DataViz😍 here's one of my faves...
https://t.co/rwC08GxaU4


Playing around with some of the Colorscape Data with @rawgraphs to make some #dataviz & #dataart

3D digital elevation model of Taiwan for day 19 of the #30DayMapChallenge - Islands.
This map was made with #Python using #Numpy, #matplotlib and #earthpy. #data #DataScience #data #dataviz #DataScientist #geography #artwork #art


Great map by @mapmakerdavid showing the world's 100 largest islands.
#dataviz #maps
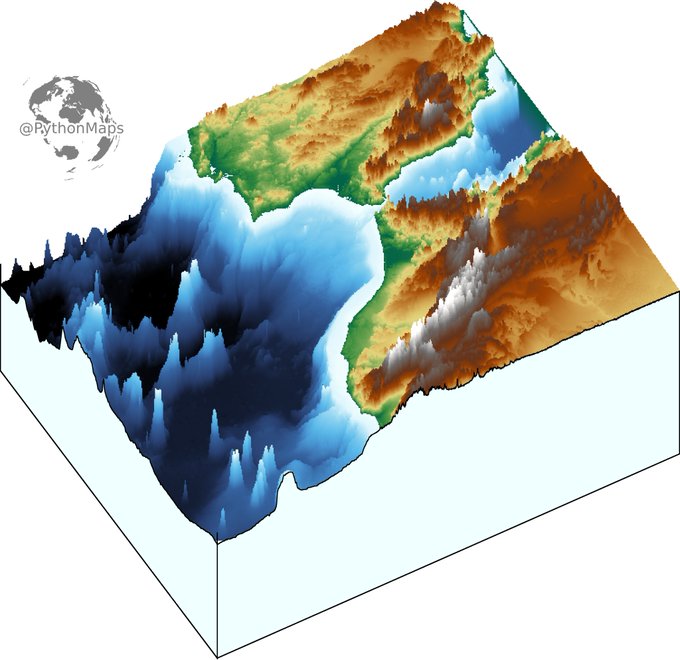
3D digital elevation model of the strait of Gibraltar for day 11 of the #30DayMapChallenge .
This map was made with #Python using #Numpy, #matplotlib and #earthpy. #data #DataScience #data #dataviz #DataScientist #eu #geography #artwork #art #Gibraltar #Brexit


Part4: Today it's time for relative humidity changing throughout the year.
Mean monthly relative humidity, calculated from #dewpoint and #temperature (1981-2020) #ERA5
created with #geemap and #EarthEngine.
The scale is non-linear for better #visualization.
#dataviz #EarthArt


Wes Anderson's new film @french_dispatch features most of the actors who appear regularly in his films!
My new @tableaupublic #dataviz shows his favorite collaborators + their roles.
Interactive: https://t.co/DDuZEXfHev
Thx @ShijiaWendy, @FlerlageKev, @flerlagekr for tutorials

Topography map of the greatest country in the world... Ireland. Colours correspond to the national flag obviously.
This map was made with #Python using #Numpy, #matplotlib and #Pandas. #data #DataScience #data #dataviz #DataScientist #Ireland #eu #geography #artwork #art