apchallengeのTwitterイラスト検索結果。 187 件中 2ページ目


I had the absolute honour of doing an art trade with the lovely @kalisdice>.<
I chose to draw my favourite character of hers, Agua. I love how deep that character is, and she feels so real to me.
#arttrade #characterswapchallenge #drawingchallenge #huion #CLIPSTUDIOPAINT


#30DayMapChallenge Day 30 (in Chicago). Meta-mapping
My neighborhood like Vassily Kandinsky's "Composition VIII" 🎨
Original painting : https://t.co/uwiqS2A4lI
Location : https://t.co/cpIlUPafNy
#qgistry


What does the world really look like? As we all know the earth is flat so here is the map of the world that we should be teaching in schools. Day 28 of the #30DayMapChallenge - #Python #Numpy, #matplotlib #. #data #DataScience #data #DataScientist #icewall #FlatEarth #sheep


#30DayMapChallenge 2021 🗺️ Day 28 - earth not flat
A very simply spinning hand-drawn globe. Learned a lot about projections today which are overall still a big mystery to me🧐
Tools: #rstats (roughsf)
Code: https://t.co/9QmPTa8qiZ

Where do the world's CO2 emissions come from? This map shows emissions during 2019. Darker areas indicate areas with higher emissions. Day 27 of the #30DayMapChallenge This map was made with #Python / #matplotlib. #DataScience #Data #DataVisualization #ClimateAction
#Climate


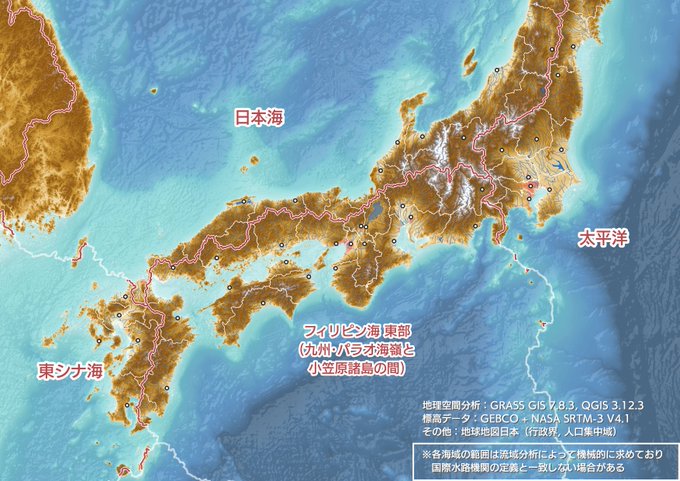

日本列島に降った雨がどの海に流れるのか、可視化してみた。
分水嶺、雨粒どうしが別々の海に注いでいくのが神秘的。トンネルを抜けると気候や植生が変わることも。
隆起と侵食が作り上げた天然の境界線、ずっと眺めていられそう…🧐
#30DayMapChallenge Day 3: Polygons - Watershed, Japan


#30DayMapChallenge 2021 🗺️ Day 24 - historical
A humble try to recreate Minards map of french wine exports with contemporary data
Tools: #rstats (a lot of packages)
Code: https://t.co/VUSnI71IAY
HighRes: https://t.co/HKqZkajxXp


#30DayMapChallenge Day 24: Historical map.
Very quick map of Middle Haast from NZ Heritage Maps. Historic map draped over relief shading. Made using QGIS and GIMP.
Data from:
https://t.co/HJ8GKepDNW
https://t.co/8BiG8wXYwc

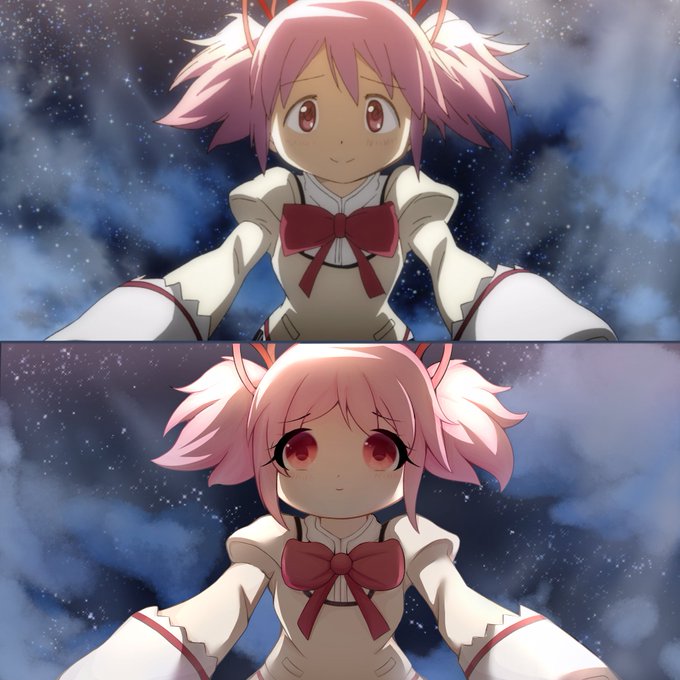
Did the screencap challenge of a screen of Madoka Magica that I still really like even tho it's over a year old already c:
#魔法少女まどかマギカ #Screencapchallenge #madoka_magica #fanart


#30DayMapChallenge day 21 - elevation. I hadn't used Blender in about four years, so decided to do something with it. Turns out in the intervening years, @domlysz released the GIS add-on, and it's amazing! Here's Mount St. Helens, slightly exaggerated.


#30DayMapChallenge Day 21: Elevation by Freya Cooper features the #CuillinHills in Isle of Skye, highlighting that the Red hills of granite to the east are rounded with fewer tall ridges, whereas the Black hills comprised of gabbro are steeper and more angular.


Day 20 of #30DayMapChallenge 2021 – Movement
My (short) season skiing at @MtHutt ski field.
Each light is a separate day of skiing, recorded with @slopesapp/@Strava and imported into @Blender #b3d with the BlenderOSM add-on.

3D digital elevation model of Taiwan for day 19 of the #30DayMapChallenge - Islands.
This map was made with #Python using #Numpy, #matplotlib and #earthpy. #data #DataScience #data #dataviz #DataScientist #geography #artwork #art

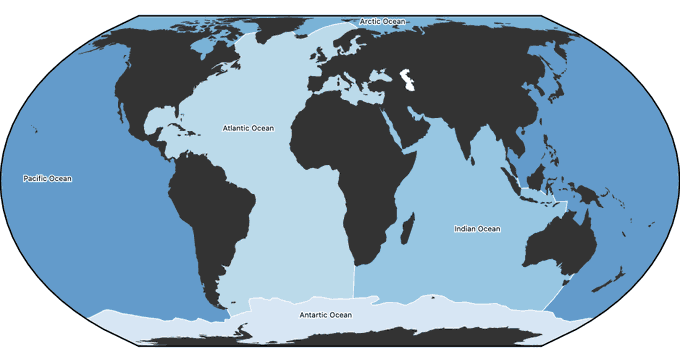
Day 18. Water. Five Oceans topojson
because I couldn't find this on the internets
https://t.co/bytvaonzZZ
#30DayMapChallenge

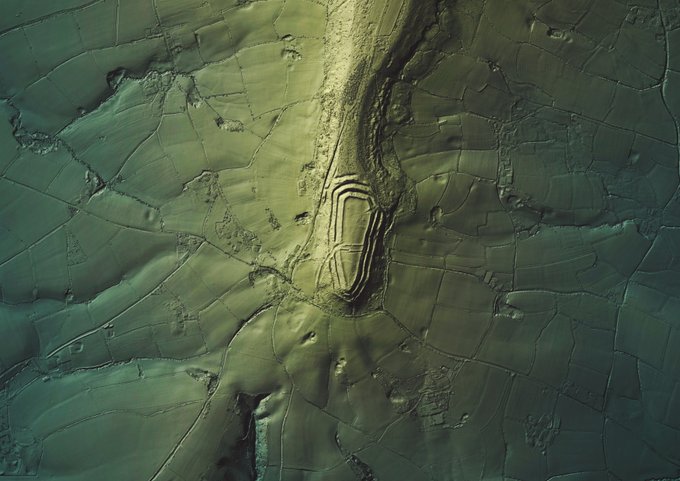

#30DayMapChallenge - 17 and #HillfortsWednesday in one today😉. Render of the impressive #Neolithic/ #IA #enclosure of #Hembury (on the edge of the #BlackdownHills in #EastDevon) and surrounding landscape from @EnvAgencyGeomat #LiDAR > #QGIS & #GIMP. #Hillfort photos below 1/n >


Southern Uplands
[SW Scotland with sea level raised to highlight upland areas. Made in Blender]
#30DayMapChallenge | Day 17 | Land

#30DayMapChallenge 2021 🗺️ Day 13 - Natural Earth Data Challenge
This is a recreation of my recreation of a map by Minard
(https://t.co/aq1acELPa0) using NE data
Tools: #rstats ({roughsf},{sf})
HighRes: https://t.co/NrQAv9NMPe


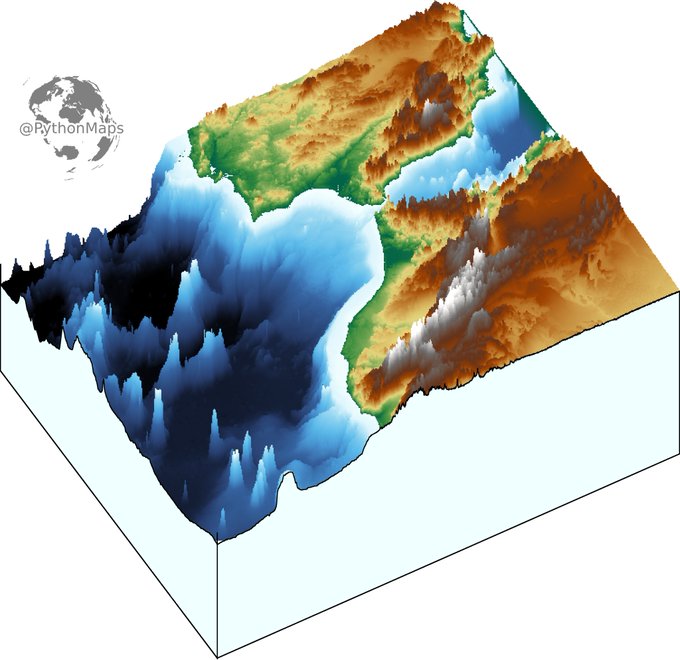
3D digital elevation model of the strait of Gibraltar for day 11 of the #30DayMapChallenge .
This map was made with #Python using #Numpy, #matplotlib and #earthpy. #data #DataScience #data #dataviz #DataScientist #eu #geography #artwork #art #Gibraltar #Brexit